Photo App Market Overview – Analyzing Competitive Advantages with Graphs
RJ0800049_13
- Last Update 08/14/2025
- File Size 1.1MB
- # of Slides 2
- File Format PPTX
- Slide Ratio 16:9
- Color
Keywords
- #Content-Based Slides
- #Design-Based Slides
- #Business Strategy
- #Market and Competitor Analysis
- #Graph
- #Achievements
- #Competitive Advantage
- #Column
- #Grouped Column
- #16:9
- #grouped bar chart PowerPoint
- #multi-series comparison chart slide
- #market analysis graph template
- #competitive advantage analysis PPT
- #how to create grouped bar chart in PowerPoint
About the Product
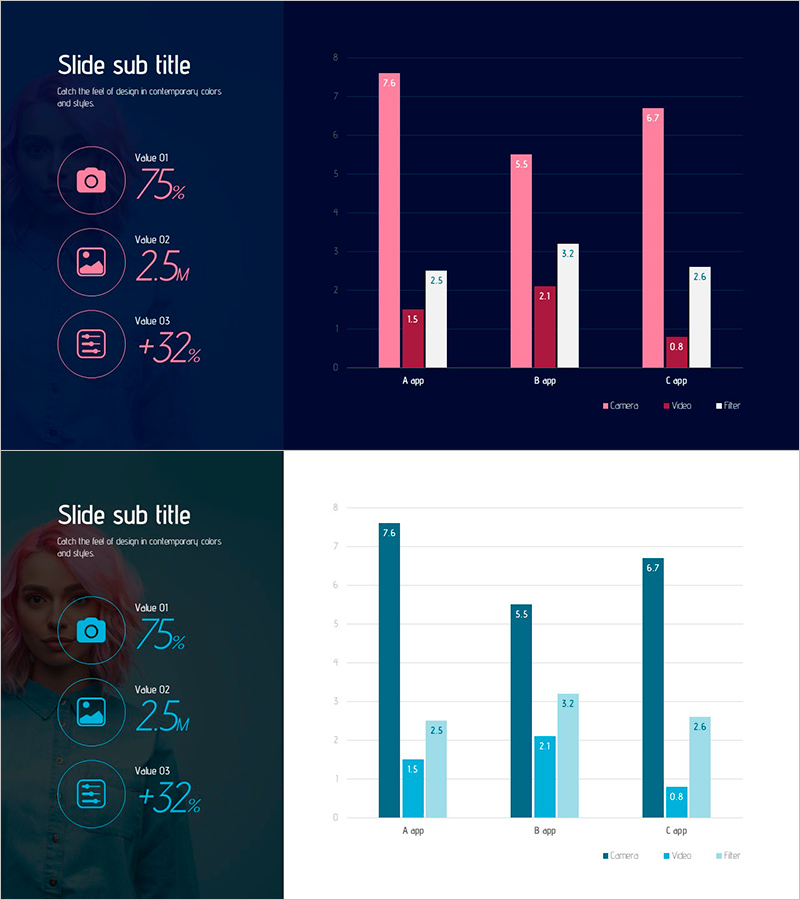
A grouped bar chart PowerPoint slide designed for photo app market analysis and competitive advantage evaluation. Set against a dark blue background, the chart displays three data series (Camera, Video, Filter) in pink, white, and wine red bars across three app categories (A app, B app, C app) for direct side-by-side comparison. The left section features circular icons with key metrics (75%, 2.5M, +32%) to highlight critical performance indicators. Includes two slide layouts—dark theme and light theme—allowing flexible presentation in any environment. Fully editable PPTX format enables quick data updates and label customization for various market analysis scenarios.
Usage Points
-
Main Usage
Enables multi-dimensional comparison of competing photo apps across key performance metrics. The grouped bar layout positions multiple indicators (Camera, Video, Filter) side-by-side for each competitor, making relative strengths and weaknesses immediately visible. Ideal for investor pitches, executive briefings, and strategic planning sessions requiring data-driven decision-making.
-
How to Use
Slide 1 features a dark blue background optimized for dimly lit presentation rooms, while Slide 2 uses a light background for bright environments. Double-click any bar to edit height, color, and numeric labels with your actual data. The left-side KPI section icons and values are also fully editable, making the template reusable across different market analyses and competitive studies.
-
Recommended For
Product strategy managers at tech and startup companies, marketing teams conducting competitive analysis reports, investor relations professionals preparing market overview sections for pitch decks, consulting firms developing benchmarking analyses, and executives presenting quarterly performance reviews to leadership.
-
Slide Structure
Slide 1 (Dark Theme): Left section contains title and KPI area with 3 circular icons plus metrics; right section displays grouped bar chart with 3 items × 3 data series (9 bars total) plus legend. Slide 2 (Light Theme): Identical structure with white and light gray background. All text, values, and colors are native PPTX objects fully editable without design tools.
Related Products
-

Comparison of Traditional Business Sales – Performance and Competitive Advantage Analysis
#Business Strategy #Market and Competitor Analysis #Graph
-

Blue Orange Growing Bar Graph – Performance and Competitive Edge
#Business Strategy #Market and Competitor Analysis #Graph
-

Internet Game Usage Graph – Performance and Competitive Advantage
#Business Strategy #Market and Competitor Analysis #Graph
-

Competitiveness Table and Chart Analysis – Market and Competitor Analysis
#Market and Competitor Analysis #Diagram #Graph
