Comparison of Traditional Business Sales – Performance and Competitive Advantage Analysis
RJ0800022_10
- Last Update 08/05/2025
- File Size 2MB
- # of Slides 2
- File Format PPTX
- Slide Ratio 16:9
- Color
Keywords
- #Content-Based Slides
- #Design-Based Slides
- #Business Strategy
- #Market and Competitor Analysis
- #Graph
- #Achievements
- #Competitive Advantage
- #Column
- #Grouped Column
- #16:9
- #grouped bar chart PowerPoint
- #sales comparison slide template
- #5-item data visualization
- #business performance analysis PPT
- #competitive advantage presentation
About the Product
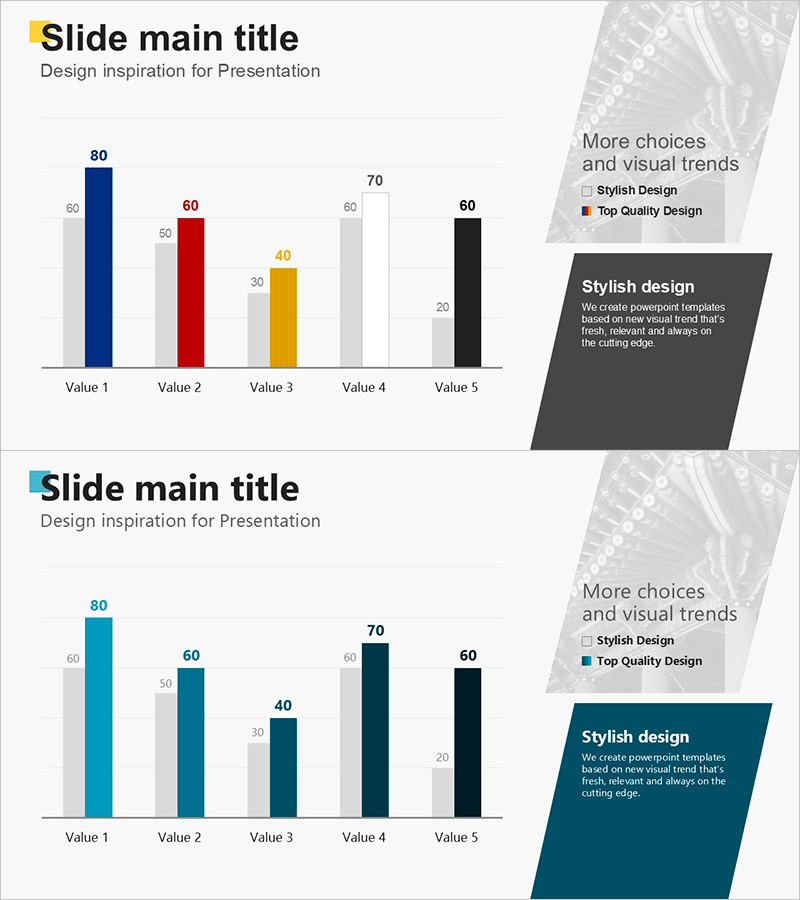
A grouped bar chart PowerPoint slide for comparing traditional business sales performance across five items. This presentation template features vertical bars in five color series—blue, red, yellow, gray, and black—to visually represent numerical values for each item. A 'Stylish Design' text box on the right side emphasizes key messages. The 2-slide set enables flexible data visualization with various color combinations, ready for immediate use in business performance reports, competitive advantage analysis, and strategic planning presentations.
Usage Points
-
Main Usage
Visualizes traditional business sales performance and competitive positioning across five metrics using grouped bar charts. Bar heights clearly show numerical differences, while multi-color coding strengthens item differentiation. Ideal for presenting current-state analysis as evidence in strategic planning and business development discussions.
-
How to Use
Input actual sales figures into the slide; bar heights adjust automatically. Modify legend and axis labels to clarify comparison items, then add key insights in the right-side text box. Use both slides to present multiple analytical perspectives with different color combinations.
-
Recommended For
Recommended for business performance reports, executive briefings, investor presentations, and strategy meetings. Ideal for professionals including executives, business planners, marketing managers, and financial analysts in traditional industries presenting quarterly or annual performance analysis.
-
Slide Structure
Two vertical grouped bar chart slides. Each slide displays five items (Value 1–5) in five color series with numerical labels above bars. A black or teal text box on the right provides space for explanatory text. Optimized for 16:9 widescreen format in modern presentation environments.
Related Products
-

Photo App Market Overview – Analyzing Competitive Advantages with Graphs
#Business Strategy #Market and Competitor Analysis #Graph
-

Blue Orange Growing Bar Graph – Performance and Competitive Edge
#Business Strategy #Market and Competitor Analysis #Graph
-

Internet Game Usage Graph – Performance and Competitive Advantage
#Business Strategy #Market and Competitor Analysis #Graph
-

Competitiveness Table and Chart Analysis – Market and Competitor Analysis
#Market and Competitor Analysis #Diagram #Graph
