Internet Game Usage Graph – Performance and Competitive Advantage
RJ0800026_15
- Last Update 08/06/2025
- File Size 0.4MB
- # of Slides 2
- File Format PPTX
- Slide Ratio 16:9
- Color
Keywords
- #Content-Based Slides
- #Design-Based Slides
- #Business Strategy
- #Market and Competitor Analysis
- #Graph
- #Achievements
- #Competitive Advantage
- #Column
- #Grouped Column
- #16:9
- #grouped bar chart PowerPoint
- #vertical bar graph slide
- #data comparison template
- #performance analysis chart
- #competitive advantage slide
About the Product
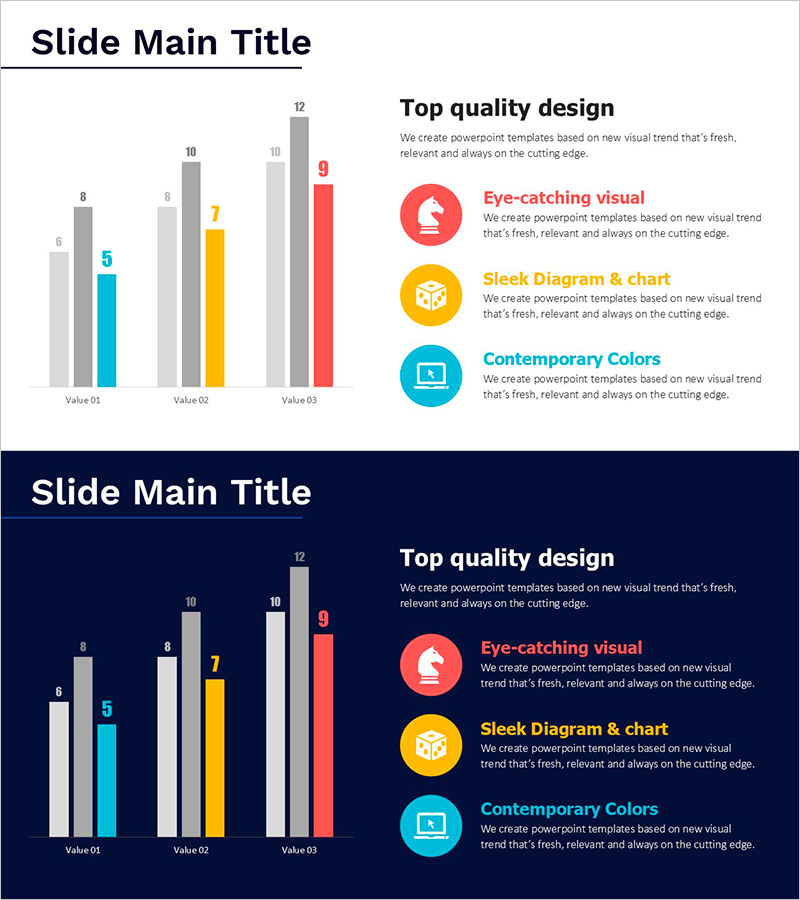
A grouped vertical bar chart PowerPoint slide template for visualizing internet game usage performance and competitive advantage. This presentation slide features three data series (Value 01, 02, 03) arranged side-by-side for intuitive item-by-item comparison. Includes two versions: light background and dark navy background, with blue, yellow, and red accent colors distinguishing each series. Ready-to-use for market analysis, performance benchmarking, and competitive positioning sections in business reports and pitch decks.
Usage Points
-
Main Usage
Displays internet game market usage metrics, performance indicators, and competitive advantages through side-by-side numerical comparison. The grouped bar layout enables instant visual comparison across categories, strengthening data credibility in reports, proposals, and business presentations.
-
How to Use
Enter actual values into each Value field (01, 02, 03) and bar heights adjust automatically. Use the light background slide for standard presentations and print materials; select the dark navy version for projector displays and online meetings. Colors and numerical labels are fully editable.
-
Recommended For
Ideal for marketing managers, business planners, data analysts, and executives presenting market trends, performance metrics, and competitive analysis. Suitable for business plans, quarterly reports, and investor presentations in gaming, IT, media, and telecommunications industries.
-
Slide Structure
2-slide set. Slide 1: Light white background with 3-series grouped vertical bar chart plus right-side text area (3 icons + descriptive text). Slide 2: Identical chart structure on dark navy background. Bar colors: blue (5, 8), yellow (7), red (9) for emphasis. 16:9 widescreen format.
Related Products
-

Photo App Market Overview – Analyzing Competitive Advantages with Graphs
#Business Strategy #Market and Competitor Analysis #Graph
-

Blue Orange Growing Bar Graph – Performance and Competitive Edge
#Business Strategy #Market and Competitor Analysis #Graph
-

Comparison of Traditional Business Sales – Performance and Competitive Advantage Analysis
#Business Strategy #Market and Competitor Analysis #Graph
-

Marketing Performance and Analysis – Visualizing Results with Graphs
#Market and Competitor Analysis #Graph #Text Box
