Blue Orange Growing Bar Graph – Performance and Competitive Edge
RJ0600109_7
- Last Update 07/20/2025
- File Size 0.3MB
- # of Slides 2
- File Format PPTX
- Slide Ratio 16:9
- Color
Keywords
- #Content-Based Slides
- #Design-Based Slides
- #Business Strategy
- #Market and Competitor Analysis
- #Graph
- #Achievements
- #Competitive Advantage
- #Column
- #Grouped Column
- #16:9
- #grouped bar chart PowerPoint
- #dual-series comparison slide
- #horizontal bar graph template
- #performance comparison chart
- #competitive analysis slide
About the Product
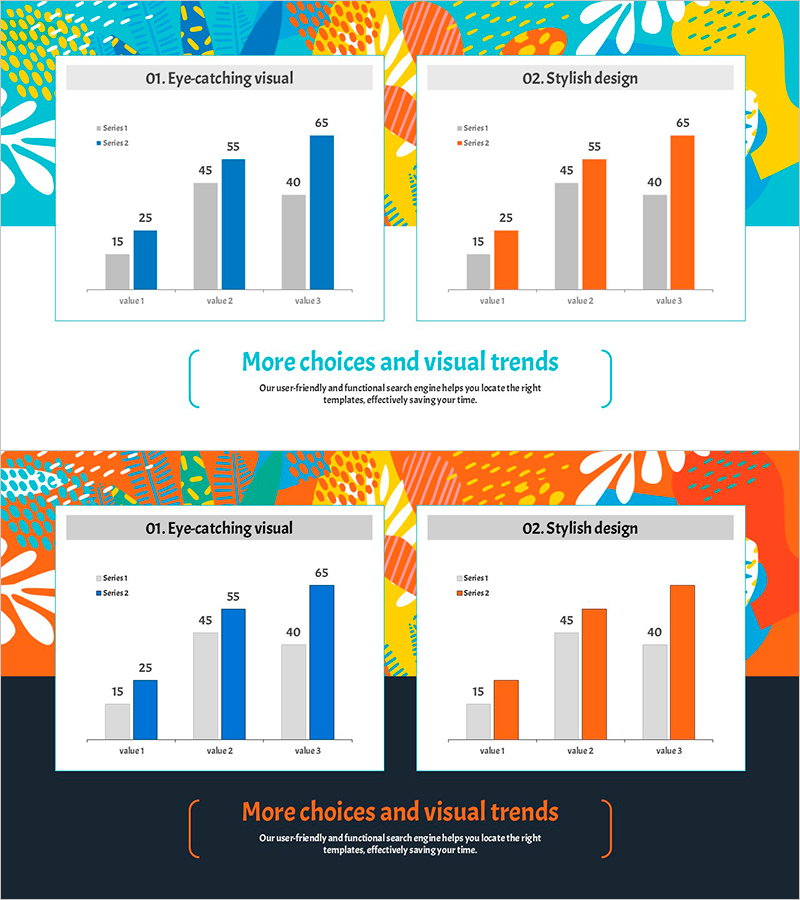
A grouped bar chart PowerPoint slide featuring blue and orange dual-series data visualization across three comparison items (value1, value2, value3). This slide design is optimized for performance metrics, competitive analysis, and market share comparisons. The contrasting blue and warm orange color scheme ensures clear visual distinction between data series, while the vibrant patterned header on a white background adds visual interest to your presentation. Delivered in 16:9 widescreen format with 2 fully editable slides in PPTX, featuring clearly labeled numerical values for maximum data clarity and professional impact.
Usage Points
-
Main Usage
Enables side-by-side comparison of two or more data series across multiple categories. Perfect for presenting performance metrics versus targets, competitive benchmarking, market share analysis, product performance comparisons, and any quantitative comparison requiring clear visual differentiation between data sets.
-
How to Use
Replace the placeholder values (value1, value2, value3) with your actual data points. Update the legend labels (Series1, Series2) to reflect your comparison categories. Colors can be retained for visual consistency or customized to match your corporate brand guidelines. Add contextual titles and descriptive text to align with your presentation narrative.
-
Recommended For
Executive reports, business plans, marketing proposals, investor pitch decks, quarterly performance reviews, competitive analysis presentations, and product comparison materials. Ideal for executives, marketing professionals, sales teams, and strategy managers who need to communicate quantitative comparisons effectively.
-
Slide Structure
Two-slide set with identical grouped bar chart layouts. Each slide features a title area at the top (Eye-catching visual / Stylish design), a central grouped bar chart displaying 3 items with 2 data series, and a descriptive text zone at the bottom for contextual messaging.
Related Products
-

Comparison of Traditional Business Sales – Performance and Competitive Advantage Analysis
#Business Strategy #Market and Competitor Analysis #Graph
-

Photo App Market Overview – Analyzing Competitive Advantages with Graphs
#Business Strategy #Market and Competitor Analysis #Graph
-

Internet Game Usage Graph – Performance and Competitive Advantage
#Business Strategy #Market and Competitor Analysis #Graph
-

Market Analysis Chart for Frequently Used Transportation Methods When Traveling
#Business Strategy #Market and Competitor Analysis #Graph
