Donut Chart for Market Share Analysis Slide
RB0800061_7
- Last Update 03/27/2025
- File Size 0.2MB
- # of Slides 2
- File Format PPTX
- Slide Ratio 4:3
- Color
Keywords
About the Product
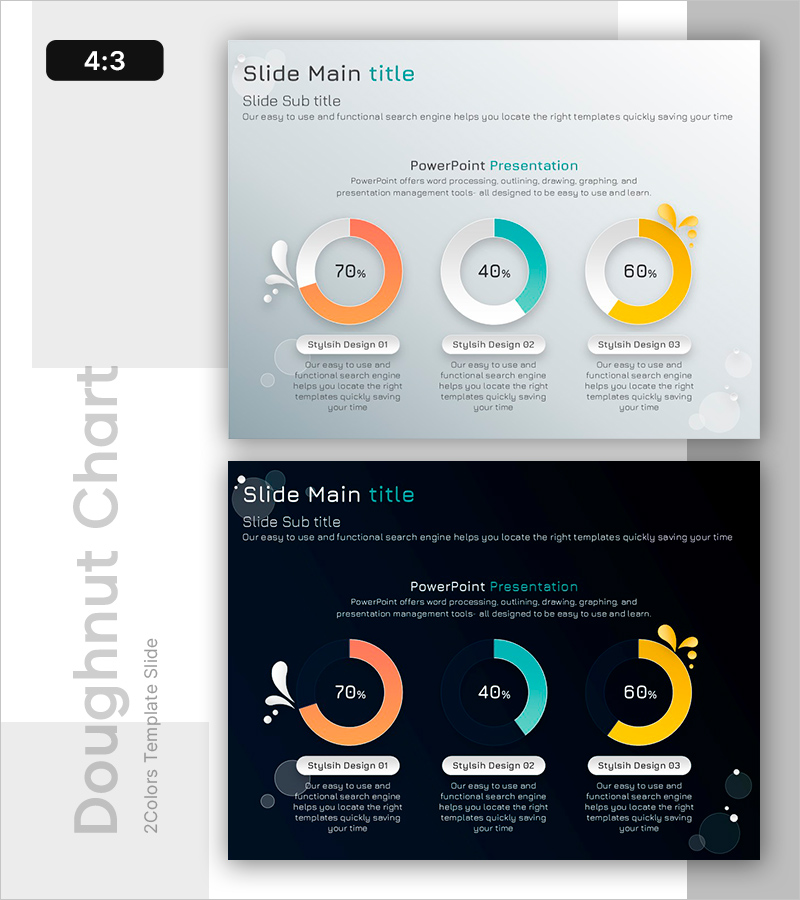
A professional donut chart PowerPoint slide optimized for market share analysis and competitive comparison. The three-color donut design in orange, teal, and yellow provides intuitive ratio visualization with a central area for emphasizing key metrics. This presentation template effectively communicates market share distribution, customer composition, sales proportion, and competitive positioning. Two background versions—light and dark—are included to match various presentation themes and venue requirements, making it versatile for corporate reports and strategic presentations.
Usage Points
-
Main Usage
Visualizes ratio-based data such as market share, customer composition, sales distribution, and brand awareness. The central donut area accommodates key percentages or metrics for emphasis, while three distinct colors enable effective multi-item comparison and competitive analysis presentation.
-
How to Use
Deploy in executive reports, business plans, and marketing strategy documents within market analysis sections for competitor share comparison or customer segmentation analysis. Use the light background version for standard presentations and the dark version for evening events or premium visual impact scenarios.
-
Recommended For
Marketing managers, business analysts, sales directors, and strategic planners presenting market analysis, competitive strategy, and customer segmentation. Particularly valuable for quarterly executive briefings, investor presentations, and strategic planning meetings requiring data-driven decision support.
-
Slide Structure
Two-slide set featuring three donut charts arranged horizontally on each slide. Each donut chart displays three data series in orange, teal, and yellow with customizable central metrics (70%, 40%, 60% examples). Description text areas below each chart accommodate additional context and explanatory information for comprehensive data storytelling.
Related Products
-

Donut Chart Slide for Game Category Analysis
#Market and Competitor Analysis #Graph #Market Status
-

Sales Status by Food Truck Product – Market Share Analysis
#Market and Competitor Analysis #Graph #Market Status
-

Construction Site Donut Chart – Market Share Visualization
#Market and Competitor Analysis #Graph #Market Status
-

Eucalyptus Donut Chart – Visualization for Market Analysis
#Market and Competitor Analysis #Graph #Market Status
