Visualizing Business Strategy with Round Line Chart – Emphasizing Market Analysis and Performance
RJ0800043_13
- Last Update 08/12/2025
- File Size 0.1MB
- # of Slides 2
- File Format PPTX
- Slide Ratio 16:9
- Color
Keywords
- #Content-Based Slides
- #Design-Based Slides
- #Business Strategy
- #Market and Competitor Analysis
- #Graph
- #Achievements
- #Competitive Advantage
- #Line
- #Line Chart
- #16:9
- #line chart PowerPoint slide
- #trend analysis presentation
- #3-series line graph
- #business performance visualization
- #market analysis chart template
About the Product
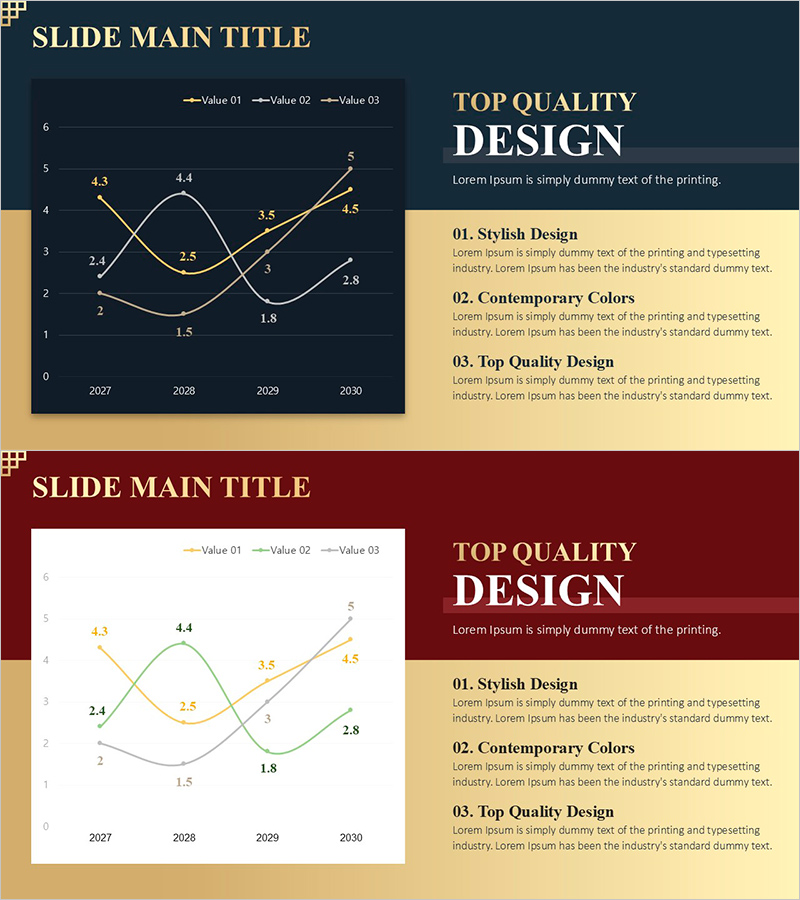
A professional 3-series line chart PowerPoint slide designed to visualize business strategy and market analysis. This 2-slide deck features a dark navy background with gold, white, and gray trend lines tracking performance from 2027 to 2030. Each data point is labeled with numerical values, making it easy to identify competitive advantages and market dynamics at a glance. The right-side text area accommodates three key insights for emphasis, enabling immediate integration into presentations and reports. Delivered in 16:9 widescreen PPTX format for seamless compatibility.
Usage Points
-
Main Usage
Illustrates year-over-year performance changes, market share evolution, and competitive benchmarking through multi-series line visualization. Enables data-driven decision-making by displaying trends and patterns intuitively across a 4-year timeline.
-
How to Use
Insert into the market analysis or performance review section of your presentation to explain annual trend progression. Populate the right-side text area with three key insights to direct audience focus. Customize data values to match your actual figures while maintaining the professional design aesthetic.
-
Recommended For
Ideal for executives, business strategists, marketing managers, and financial analysts preparing quarterly or annual performance reports, business plans, investor pitch decks, and market analysis presentations. Particularly effective when emphasizing competitive positioning and strategic achievements.
-
Slide Structure
Two-slide layout with a 3-series line chart on the left (4 data points per series from 2027-2030 with labeled values) and a title plus three-item text box on the right. Color scheme combines dark navy, gold, and cream tones for a professional, premium appearance.
Related Products
-

The Population Graph of Animals and Plants – Visualizing Competitive Advantage
#Business Strategy #Market and Competitor Analysis #Diagram
-

Functional Cosmetics Market Size Graph – Growth and Opportunities
#Business Strategy #Market and Competitor Analysis #Graph
-

Red Black Curved Line Trend – Market Analysis and Competitive Advantage
#Business Strategy #Market and Competitor Analysis #Graph
-

American Football Match Performance Status – Highlighting Competitive Advantage
#Business Strategy #Market and Competitor Analysis #Graph
