Pink Blue Comparison Type Horizontal Bar Chart – Visually Striking Data Comparison
RJ0800044_6
- Last Update 08/12/2025
- File Size 0.2MB
- # of Slides 2
- File Format PPTX
- Slide Ratio 16:9
- Color
Keywords
About the Product
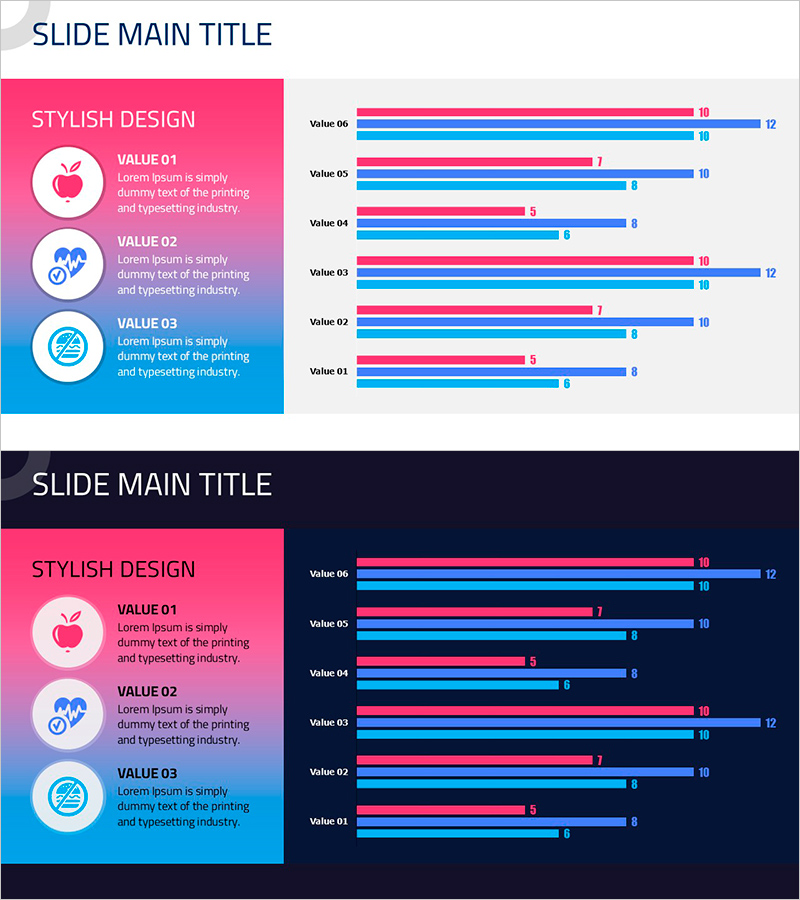
A horizontal bar chart PowerPoint slide featuring contrasting pink and blue dual-tone colors for comparing numerical data across 6 items in 2 data series. The layout clearly separates the left icon section from the right graph area, making it ideal for business presentations requiring data visualization. Two versions are included: a light background version for standard presentations and a dark background version for executive reports. Perfect for sales performance, KPI comparisons, departmental metrics, and quarterly results analysis in business proposals and reports.
Usage Points
-
Main Usage
Displays 6 data items compared across 2 series using horizontal bars in contrasting pink and blue colors. The dual-color design emphasizes comparative analysis and makes data differences immediately visible. Optimized for quantitative data visualization in business contexts such as sales figures, performance metrics, departmental comparisons, and quarterly results.
-
How to Use
Enter category names in the left icon area and adjust bar lengths to match your data values. Use the light background version for standard presentations and reports, and the dark background version for high-level executive presentations. All colors, values, and text are fully editable to match your branding and data.
-
Recommended For
Sales and marketing teams presenting performance comparisons, finance and executive teams reporting results, consulting proposals with benchmarking data, educational seminars explaining statistics, business plans showing target vs. actual performance, and any presentation requiring quantitative evidence and data-driven insights.
-
Slide Structure
2-slide set. Each slide features 3 icons on the left (VALUE 01–03) paired with 6 data items on the right (Value 01–06) displayed as horizontal bars. Each item shows 2 bars side-by-side in pink and blue, enabling direct visual comparison of values across categories.
Related Products
-

Competitive Advantage 3D Bi-directional Bar Graph – Essential Tool for Market Analysis
#Market and Competitor Analysis #Graph #Competitor Analysis
-

Market Share and Analysis Graph – Red and Blue Integration
#Market and Competitor Analysis #Graph #Market Share
-

Space Exploration Donut Pie Chart
#Product/Service Introduction #Market and Competitor Analysis #Graph
-

Blackboard Chalk Theme Market Analysis Graph – Creative Data Visualization
#Technical Approach #Market and Competitor Analysis #Graph
