Business Meeting Results Analysis Graph
RJ0400050_22
- Last Update 05/31/2025
- File Size 1.2MB
- # of Slides 2
- File Format PPTX
- Slide Ratio 16:9
- Color
Keywords
About the Product
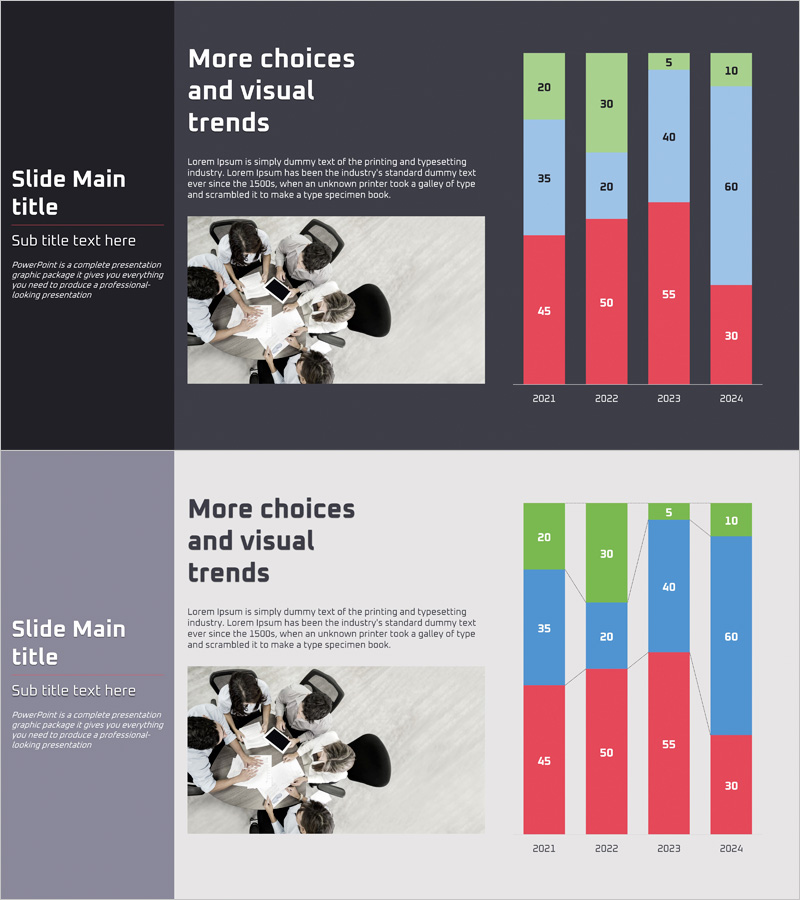
A professional PowerPoint slide featuring vertical and horizontal stacked bar charts for visualizing business meeting results and market analysis data. The design displays a 4-year trend from 2021 to 2024 across three data series represented in red, green, and light blue colors. Each bar includes numeric labels for precise data comparison. The dark background with high-contrast colors ensures excellent readability during presentations, making it ideal for sales performance reports, market share analysis, and competitive benchmarking. The 2-slide set presents the same dataset in both vertical and horizontal orientations, allowing you to choose the format that best suits your presentation narrative and emphasizes your key message.
Usage Points
-
Main Usage
This slide excels at simultaneously displaying year-over-year data trends and comparative values across categories. The vertical bar chart emphasizes temporal progression and change patterns, while the horizontal bar chart highlights relative magnitude differences between items. The three-color coding (red, green, light blue) clearly distinguishes data categories, and numeric labels on each bar ensure precise value communication without ambiguity.
-
How to Use
Use this template when presenting quarterly or annual sales performance, market share metrics, or competitive analysis data in business meetings. The professional dark background design is particularly suited for executive briefings, investor presentations, and strategic planning sessions. The 2-slide format allows you to build narrative momentum: present the vertical trend chart first to establish temporal context, then reveal the horizontal comparison chart to drive decision-making insights.
-
Recommended For
Marketing managers, sales directors, financial analysts, and executives preparing quarterly performance reports, market analysis, and competitive benchmarking materials will find this template invaluable. It is especially effective in data-driven decision-making contexts such as executive board meetings, investor relations presentations, and strategic planning workshops where numerical credibility is paramount.
-
Slide Structure
Slide 1: Vertical stacked bar chart displaying 4-year progression (2021–2024) with three data series in red, green, and light blue. Numeric labels positioned above each bar segment for clarity. Slide 2: Identical dataset rendered as horizontal stacked bar chart emphasizing item-to-item comparison. Dark background with high-contrast colors optimized for projector visibility and professional presentation environments.
Related Products
-

Business Goal Setting & Analysis Graph – For Competitive Analysis
#Market and Competitor Analysis #Marketing Plan and Strategy #Graph
-

Analysis Vertical Bar Graph – Market Competitiveness Visualization
#Market and Competitor Analysis #Graph #Competitor Analysis
-

Vertical Bar Market Analysis Segmentation Graph - Data Visualization
#Market and Competitor Analysis #Graph #Competitor Analysis
-

Analysis of Courier Brand Usage Status – Insights on Competitors
#Market and Competitor Analysis #Graph #Competitor Analysis
