US Target Market User Analysis Slide
RJ0400051_23
- Last Update 05/31/2025
- File Size 4.9MB
- # of Slides 2
- File Format PPTX
- Slide Ratio 16:9
- Color
Keywords
- #Content-Based Slides
- #Design-Based Slides
- #Market and Competitor Analysis
- #Marketing Plan and Strategy
- #Graph
- #Other
- #Target Market
- #Target Market Strategy
- #16:9
- #target market analysis PowerPoint
- #market analysis slide template
- #geographic market distribution slide
- #how to present market analysis in PowerPoint
- #regional market analysis deck
About the Product
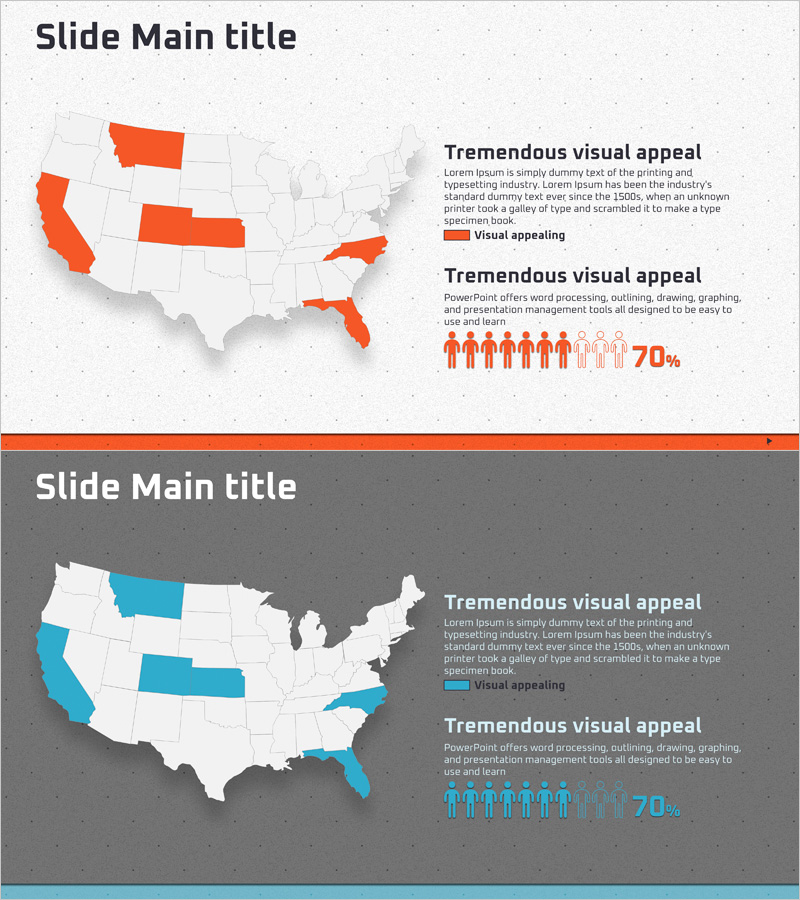
A PowerPoint slide set visualizing US regional market distribution with geographic mapping and statistical data. This presentation template includes two design versions: a vibrant color map layout and a neutral gray background variant. Each slide features a regional distribution map, text description areas, and icon-based statistical information to clearly communicate market penetration and customer concentration. Designed in 16:9 widescreen format for modern projectors and displays, fully editable in PPTX format for immediate customization and deployment in marketing strategy presentations.
Usage Points
-
Main Usage
Communicate market distribution and customer demographics during strategic planning presentations. Combines geographic visualization with statistical metrics to help stakeholders understand regional market share, customer concentration, and expansion opportunities at a glance.
-
How to Use
Replace placeholder text with actual regional market size, growth rates, and target customer demographics for each area. Customize icon-based statistics (e.g., 70% user ratio) with real data to strengthen presentation credibility. Use the color version for high-impact presentations and the gray version for formal business meetings.
-
Recommended For
Marketing managers, business development teams, investment pitch presenters, and market research analysts. Ideal for new market entry strategies, regional marketing plan presentations, investor briefings, and competitive market analysis reports.
-
Slide Structure
Each slide contains a title section at the top, a central regional distribution map (color or gray variant), two text description boxes on the right side, and statistical information with icons and percentages at the bottom. Both slides maintain consistent layout for cohesive presentation flow.
Related Products
-

US Target Market Analysis Graph – Understanding Market Segmentation
#Market and Competitor Analysis #Marketing Plan and Strategy #Graph
-

European Target Market Distribution
#Market and Competitor Analysis #Marketing Plan and Strategy #Graph
-

European Region Survey Pie Chart – Market Analysis and Strategy
#Market and Competitor Analysis #Marketing Plan and Strategy #Graph
-

European Target Country Analysis Graph – Insightful Marketing Strategy
#Market and Competitor Analysis #Marketing Plan and Strategy #Graph
