Donut Chart for Korean Culture Awareness – Market Share Analysis
RJ0800043_28
- Last Update 08/12/2025
- File Size 0.3MB
- # of Slides 2
- File Format PPTX
- Slide Ratio 16:9
- Color
Keywords
- #Content-Based Slides
- #Design-Based Slides
- #Market and Competitor Analysis
- #Marketing Plan and Strategy
- #Graph
- #Market Share
- #Marketing Strategy
- #Circles
- #Doughnut Chart
- #16:9
- #donut chart PowerPoint
- #pie chart slide template
- #market share analysis PPT
- #data visualization slides
- #marketing presentation template
About the Product
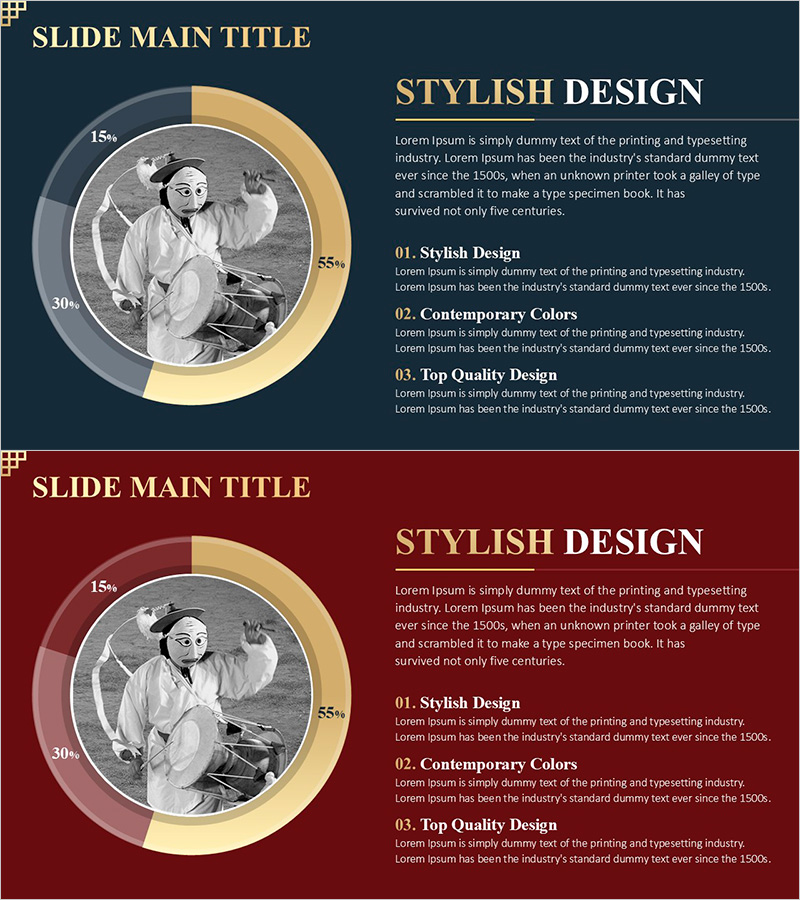
A donut chart PowerPoint slide template for visualizing Korean culture awareness and market share distribution. The design features a dark navy background with a gold-bordered circular frame containing a black-and-white image in the center, accompanied by three text descriptions on the right side. The 4-segment donut chart clearly displays proportional data such as 15%, 30%, and 55%, making it ideal for marketing strategies, market analysis, and executive reports. Delivered in editable PPTX format with 2 slides in 16:9 widescreen ratio, ready for immediate use in business presentations.
Usage Points
-
Main Usage
Optimized for visualizing part-to-whole relationships such as market share, customer composition, and sales distribution. The donut format allows additional information or key metrics to be inserted in the center, providing greater information density than traditional pie charts.
-
How to Use
Use in marketing strategy presentations, quarterly performance reports, customer segmentation analysis, and brand awareness survey results. Easily customize segment colors and percentages to match your specific data and presentation needs.
-
Recommended For
Marketing professionals, executives, sales teams, market research specialists, and consultants presenting data-driven insights. Particularly suitable for Korean market analysis, cultural industry reports, and consumer awareness studies.
-
Slide Structure
2-slide set with dark navy background and gold-bordered circular frames. Each slide features a 4-segment donut chart (15%, 30%, 55%, etc.) on the left side with three numbered text descriptions aligned on the right. Formatted in 16:9 widescreen ratio for modern presentation environments.
Related Products
-

Donut Graph by Caries Erosion Status – Essential for Market Analysis
#Business Introduction #Market and Competitor Analysis #Graph
-

Navigation App Market Share Graph Analysis – Effective Data Visualization
#Market and Competitor Analysis #Graph #Market Share
-

Donut Chart Visualizing Merchandise Sales Proportion
#Market and Competitor Analysis #Graph #Market Share
-

Doughnut Chart Visualizing Current Status of 3D Printing Technology Development
#Product/Service Introduction #Market and Competitor Analysis #Graph
