Recent Market Status Slide with Donut Chart
RJ0900030_13
- Last Update 08/25/2025
- File Size 0.6MB
- # of Slides 2
- File Format PPTX
- Slide Ratio 16:9
- Color
Keywords
- #Content-Based Slides
- #Design-Based Slides
- #Market and Competitor Analysis
- #Graph
- #Market Status
- #Market Share
- #Circles
- #Doughnut Chart
- #16:9
- #donut chart PowerPoint slide
- #pie chart template
- #market share visualization
- #data representation slide
- #percentage chart PowerPoint
- #business analytics presentation template
About the Product
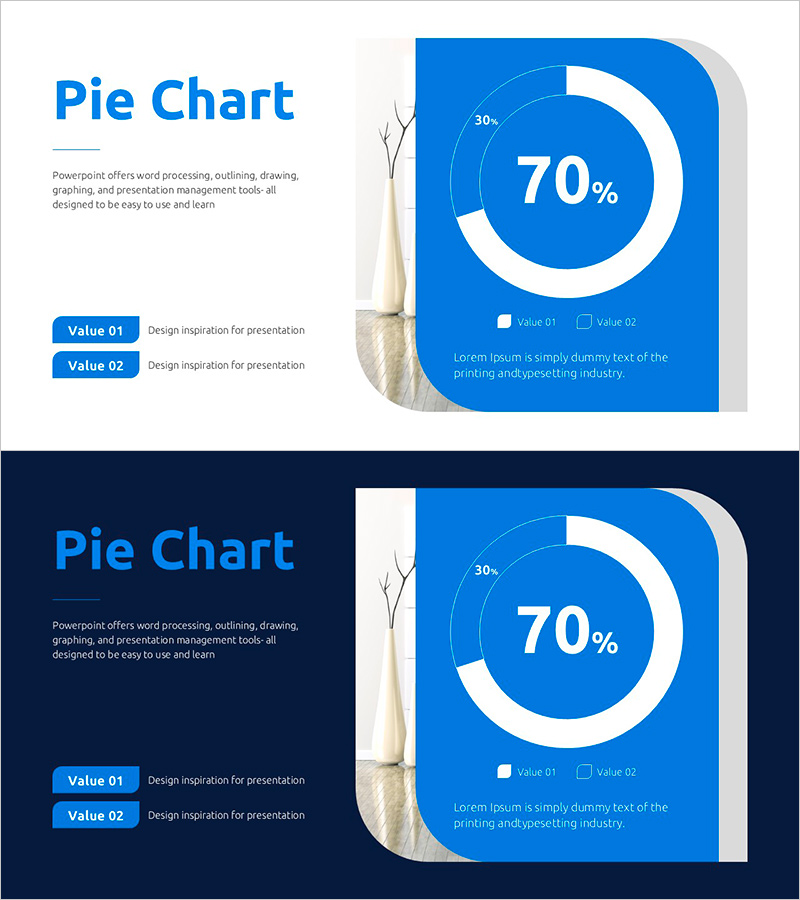
A professional donut chart PowerPoint slide designed to visualize market share and proportional data with clarity and impact. The slide features a dual-ring circular structure with 70% highlighted in the center and 30% displayed on the outer ring, using a vibrant blue color scheme. Two layout versions are included: a light background design and a dark navy background option, both with left-side legend areas (Value 01, Value 02) and descriptive text zones. A decorative white vase element adds visual balance to the right side. Available in 16:9 widescreen PPTX format, fully editable for immediate use in marketing reports, business analysis presentations, market research briefings, and investor pitches.
Usage Points
-
Main Usage
Effectively communicate proportional relationships between two data segments using a visually compelling donut chart format. The 70% center value draws immediate attention while the 30% outer ring provides comparative context, making it ideal for executive summaries, quarterly reports, and stakeholder communications where clear data hierarchy is essential.
-
How to Use
Replace Value 01 and Value 02 labels with your actual data categories. Update the 70% and 30% figures to match your dataset. Add analysis insights or market commentary in the left text area. Customize colors to align with your brand guidelines if needed. Choose between the light or dark background version based on your presentation environment and display setup.
-
Recommended For
Marketing managers, business analysts, financial reporting professionals, and executives presenting market analysis, revenue composition, customer segmentation, budget allocation, or competitive positioning. Ideal for quarterly performance reviews, new business pitches, investor relations presentations, consulting proposals, and strategic planning meetings where proportion-based data requires clear visual communication.
-
Slide Structure
Two-slide set with consistent layout: left section contains title, legend (Value 01/Value 02), and descriptive text area; right section features the donut chart with dual-ring structure (30% outer ring, 70% center emphasis) and decorative white vase element. One light background version and one dark navy background version provided, both in 16:9 widescreen format for maximum compatibility and visual flexibility.
Related Products
-

Management System Donut Chart Slide – Market Share and Status
#Market and Competitor Analysis #Graph #Market Status
-

Enrollment Stats & Ratios Donut Chart
#Market and Competitor Analysis #Graph #Market Status
-

Marking Milestones with Market Data – Market Status and Share
#Market and Competitor Analysis #Graph #Market Status
-

Pie Chart for Decimal Ratio Analysis – Market Share Status
#Market and Competitor Analysis #Graph #Market Status
