Functional Cosmetics Market Size Graph – Growth and Opportunities
RJ0800039_25
- Last Update 08/11/2025
- File Size 0.2MB
- # of Slides 2
- File Format PPTX
- Slide Ratio 16:9
- Color
Keywords
About the Product
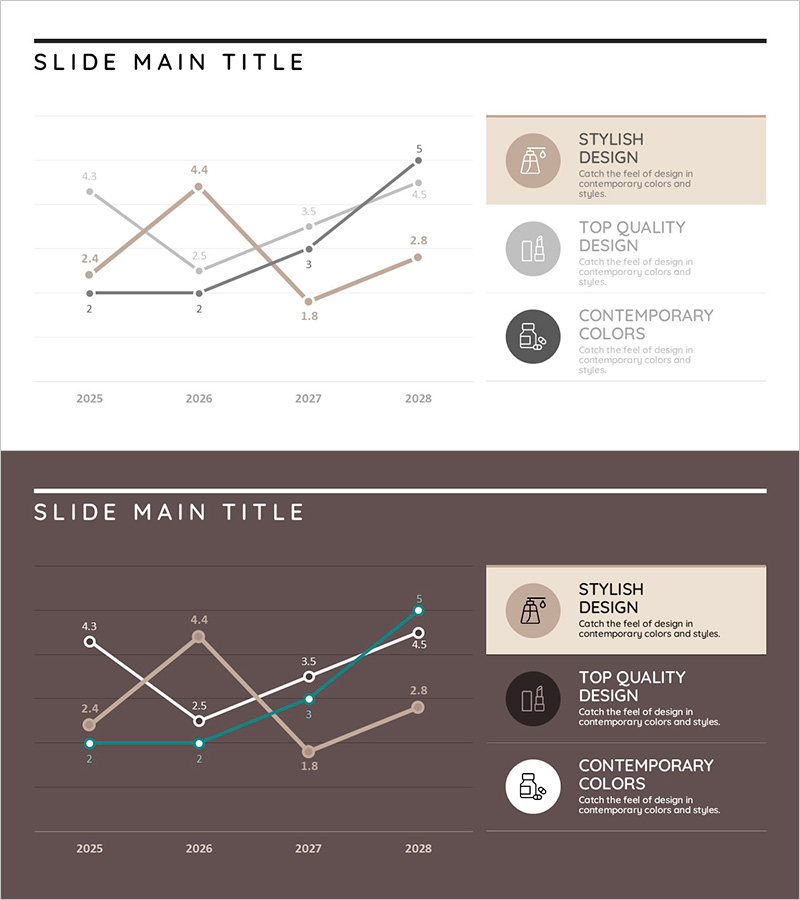
A professional line chart PowerPoint slide visualizing four-year market growth trends from 2025 to 2028. This presentation template displays three data series simultaneously, making it ideal for competitive analysis, market size evolution, and performance metrics tracking. The neutral color palette—beige, gray, and charcoal—suits business presentations, with a clear legend box on the right distinguishing each series. Two slide versions are included: one with a light background and one with a dark background, allowing you to select the best fit for your presentation environment.
Usage Points
-
Main Usage
This slide excels at displaying numerical changes over time with clarity and impact. Use it to present market size growth, revenue fluctuations, customer satisfaction trends, or competitive performance comparisons. Multiple data series can be shown simultaneously, providing comprehensive evidence for strategic decisions.
-
How to Use
Insert this slide into the market analysis, performance reporting, or strategy sections of your presentation. Replace the legend text and axis labels with your actual data, and adjust the line colors as needed. Use the light background version for daytime presentations and the dark version for evening projections or dark-themed decks.
-
Recommended For
Ideal for executives, business analysts, marketing managers, and financial professionals preparing quarterly reports, investor pitch decks, business plans, marketing strategies, and market analysis presentations. Particularly effective when comparing multiple indicators simultaneously.
-
Slide Structure
X-axis displays 4 years (2025–2028), Y-axis shows numerical scale, 3 data series with 6–7 data points each, and a legend box with 3 items on the right. Layout comprises three zones: title area at top, chart area in center, and legend area on the right.
Related Products
-

Visualizing Business Strategy with Round Line Chart – Emphasizing Market Analysis and Performance
#Business Strategy #Market and Competitor Analysis #Graph
-

The Population Graph of Animals and Plants – Visualizing Competitive Advantage
#Business Strategy #Market and Competitor Analysis #Diagram
-

Red Black Curved Line Trend – Market Analysis and Competitive Advantage
#Business Strategy #Market and Competitor Analysis #Graph
-

Trends in the Number of Professional Tennis Spectators – Performance and Competitive Advantage
#Business Strategy #Market and Competitor Analysis #Graph
