An Analysis of Hamburger Market Trends – SWOT and Market Dynamics
RJ0800042_8
- Last Update 08/12/2025
- File Size 3.1MB
- # of Slides 2
- File Format PPTX
- Slide Ratio 16:9
- Color
Keywords
- #Content-Based Slides
- #Design-Based Slides
- #Market and Competitor Analysis
- #Financial Plans and Performance
- #Graph
- #Industry Trends
- #Projected Return on Investment (ROI)
- #Line
- #Line Chart
- #16:9
- #line chart PowerPoint slide
- #market trend analysis presentation
- #dual-series graph template
- #data comparison slide
- #trend visualization PowerPoint
About the Product
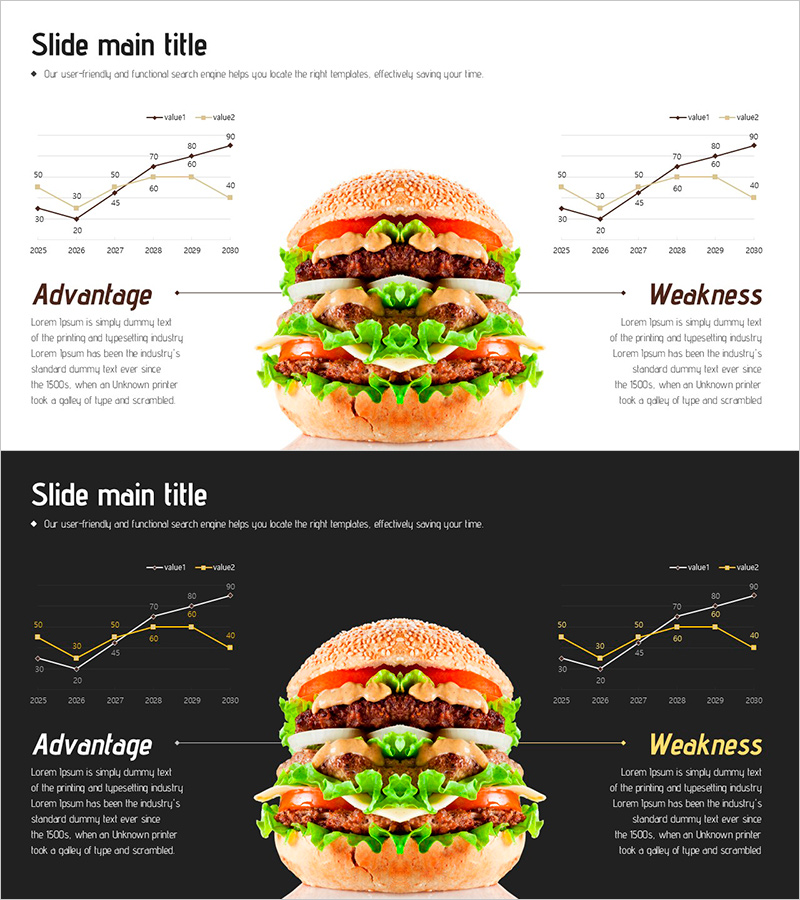
A PowerPoint slide featuring dual-series line charts to compare and analyze market trends from 2025 to 2030. The layout positions a central product image with advantage and weakness text sections on either side, making it ideal for SWOT analysis and competitive comparison. The 16:9 format across 2 slides integrates data visualization with strategic messaging, perfect for market analysis reports, marketing presentations, and business proposals that require trend comparison.
Usage Points
-
Main Usage
Visualize and compare two data series over time while simultaneously presenting advantages and disadvantages through a balanced layout with central imagery and flanking text sections.
-
How to Use
Use in market analysis sections of marketing plans, performance comparisons in business reports, and competitive positioning in proposals. Edit chart values and text to immediately deploy as presentation slides.
-
Recommended For
Marketing managers, business strategists, consultants, financial analysts, and product managers presenting market dynamics, sales trends, customer satisfaction changes, or competitive performance benchmarks.
-
Slide Structure
Each slide contains a title area, two line charts (2025-2030 data with dual series), a central product image, left-side advantage text box, and right-side weakness text box for balanced strategic comparison.
Related Products
-

Market Analysis Template with Line Graphs and Horizontal Bar Charts
#Market and Competitor Analysis #Graph #Market Analysis
-

Annual Content Trend Evolution – Market Trend Analysis
#Market and Competitor Analysis #Diagram #Graph
-

Market Trend Line Graph – Business Strategy
#Business Strategy #Market and Competitor Analysis #Graph
-

City Background Broken Line Graph – Market Trend Analysis
#Market and Competitor Analysis #Graph #Market Analysis
