Red Green Basic Line Charts – Visualizing Financial Performance
RJ0600041_15
- Last Update 07/01/2025
- File Size 0.2MB
- # of Slides 2
- File Format PPTX
- Slide Ratio 16:9
- Color
Keywords
About the Product
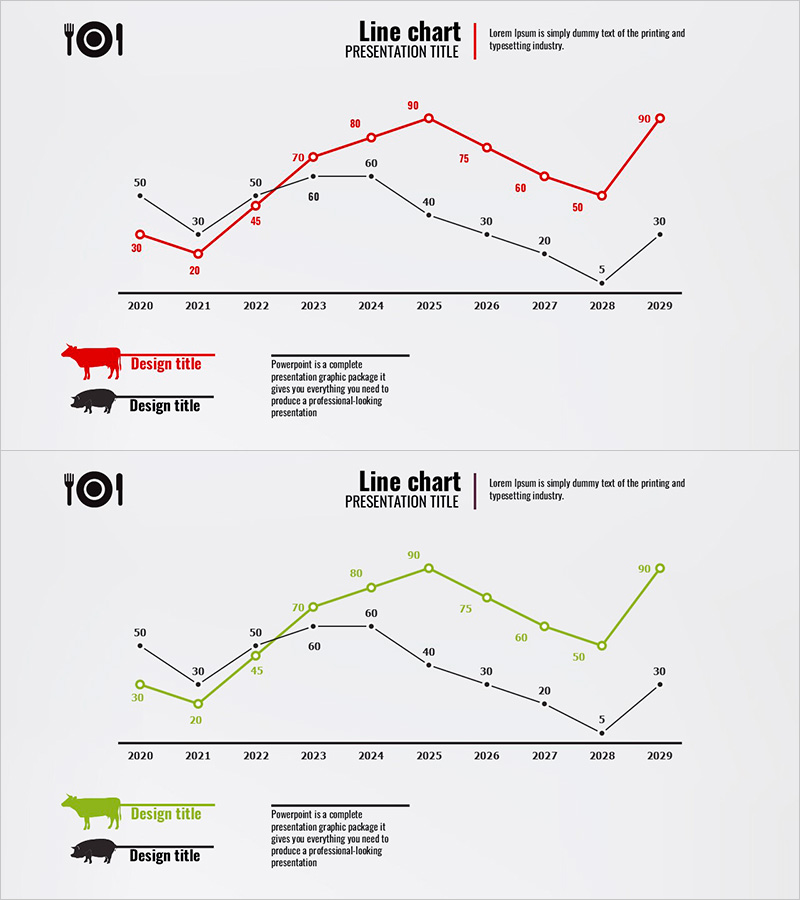
A professional line chart PowerPoint slide comparing financial performance across three data series from 2020 to 2029. The slide uses red, black, and green color-coded lines to distinguish between different metrics, with data point labels clearly displayed for precise value identification. This design is optimized for visualizing ROI, revenue, expenses, and other financial indicators over a 10-year period. Created in 16:9 widescreen format and fully editable in PPTX, allowing quick customization of data and labels.
Usage Points
-
Main Usage
Visualize and compare multiple financial metrics over time to communicate performance trends and analytical insights. The multi-line structure enables simultaneous comparison of revenue, profit, ROI, and other key indicators across a decade, making complex financial data accessible and actionable.
-
How to Use
Use in financial reports, quarterly earnings presentations, investor relations meetings, and executive briefings to illustrate historical performance and trends. Simply replace the data values and labels with your actual figures to create a customized, professional-looking financial analysis slide.
-
Recommended For
CFOs, financial analysts, business managers, investor relations professionals, and strategic planners presenting financial performance to stakeholders. Ideal for annual reports, shareholder meetings, board presentations, and investment pitch decks requiring credible data visualization.
-
Slide Structure
Two-slide set featuring identical line chart layouts with different color schemes (red/black/green and green/black/gray). X-axis spans 2020–2029 (10 years), Y-axis ranges 0–90. Each data point is labeled with precise numerical values for clarity and accuracy.
Related Products
-

Graph Slide Showing Status of Food Truck Sales
#Financial Plans and Performance #Diagram #Graph
-

Liquor Sales Line Chart – Visualizing Revenue and Profit
#Financial Plans and Performance #Graph #Projected Return on Investment (ROI)
-

Business Operation Cost Analysis Graph – Core of Financial Planning
#Financial Plans and Performance #Diagram #Graph
-

Key Sales Analysis Donut Chart – Visualizing Financial Performance
#Financial Plans and Performance #Graph #Other
