Market Trends Comparison Bar Graph – An Easy Way to Visualize Data
RJ0800041_18
- Last Update 08/11/2025
- File Size 5.6MB
- # of Slides 2
- File Format PPTX
- Slide Ratio 16:9
- Color
Keywords
About the Product
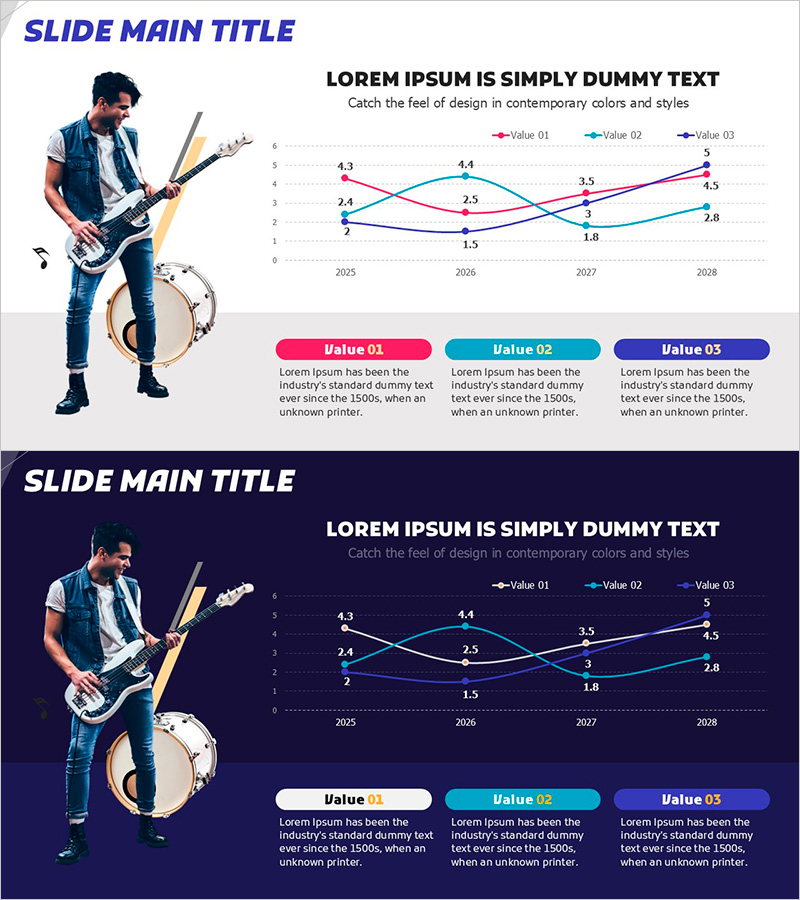
A multi-series line chart PowerPoint slide designed to compare three data streams across a four-year period from 2025 to 2028. This presentation template uses pink, cyan, and navy blue to distinguish each data series, with clearly labeled data points at each time interval. The slide deck includes two layout versions—one with a light background for printed reports and one with a dark background for projector presentations. Perfect for business reports, quarterly performance reviews, and strategic planning documents that require clear trend visualization and comparative analysis.
Usage Points
-
Main Usage
Visualize and compare multiple performance indicators or market trends over time. Ideal for displaying sales growth, customer acquisition, market share changes, or competitive benchmarking across multiple quarters or years.
-
How to Use
Replace the sample data values and series labels with your own metrics. Use the light version for printed materials and PDFs, and the dark version for live projector presentations. Colors and the number of data series can be customized to match your brand or data requirements.
-
Recommended For
Executive dashboards, quarterly earnings presentations, marketing strategy reviews, investor pitch decks, and business plan financial projections. Suitable for finance, sales, and strategy teams presenting data-driven insights.
-
Slide Structure
Each slide contains a title area, a line chart with three data series plotted across four time points (2025-2028), a legend identifying Value 01, 02, and 03, and three supporting text boxes. The Y-axis ranges from 0 to 6 with clear gridlines for easy data reading.
Related Products
-

Virus Analysis Broken Line Graph – Market and Competitor Analysis
#Market and Competitor Analysis #Graph #Competitor Analysis
-

Data Analysis Graph Visualization for Market Competition
#Market and Competitor Analysis #Diagram #Graph
-

Medical Development Data Analysis Graph – Market and Competitor Analysis
#Market and Competitor Analysis #Graph #Competitor Analysis
-

Competitor Analysis Broken Line Graph – Market Insights Provided
#Market and Competitor Analysis #Graph #Competitor Analysis
