Comparison Chart of Pet Expenditure – Essential Template for Competitor Analysis
RJ0800040_29
- Last Update 08/11/2025
- File Size 0.4MB
- # of Slides 2
- File Format PPTX
- Slide Ratio 16:9
- Color
Keywords
- #Content-Based Slides
- #Design-Based Slides
- #Market and Competitor Analysis
- #Diagram
- #Graph
- #Competitor Analysis
- #Industry Trends
- #Table
- #Column
- #Standard Table
- #Segmented Column
- #16:9
- #horizontal bar chart PowerPoint
- #stacked bar chart template
- #comparison analysis slide
- #pet expenditure data visualization
- #market analysis graph
About the Product
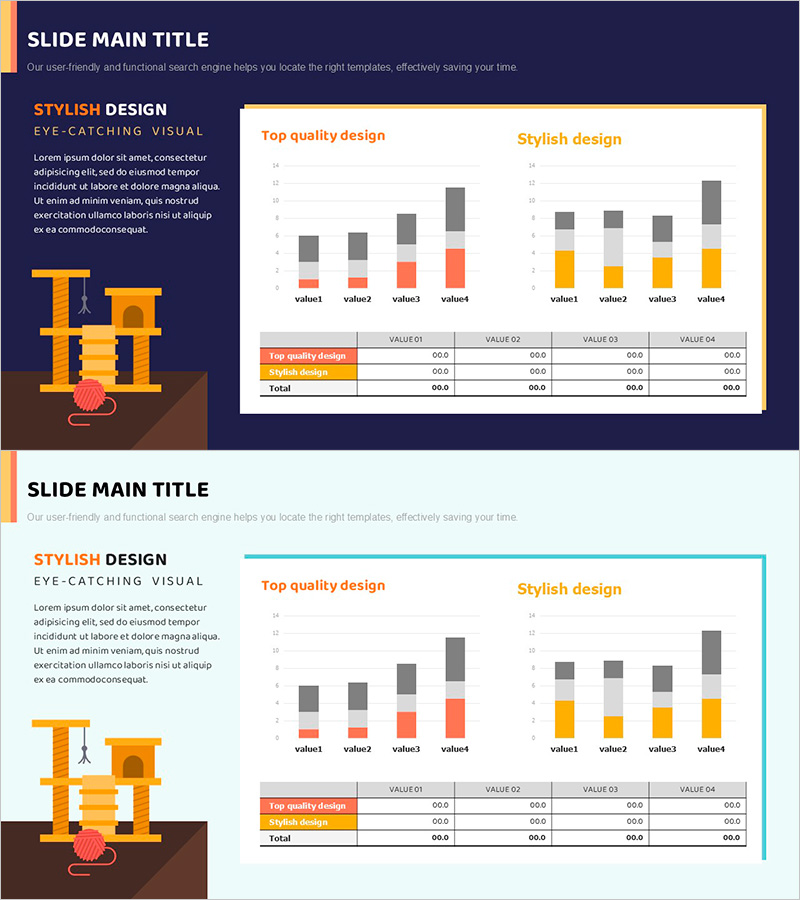
A horizontal stacked bar chart PowerPoint slide comparing pet-related expenditures across 4 categories. The design uses orange and gray color gradients to clearly visualize the composition ratio of each item, with a data table below providing quantitative evidence. The 2-slide set presents the same data against two different background colors (dark navy and light cyan), allowing flexible selection based on presentation context. Immediately applicable as a PPT template for market analysis, competitor comparison, budget allocation, and data-driven decision-making presentations.
Usage Points
-
Main Usage
Quantitatively compare pet industry expenditure categories and visualize the market share of each segment at a glance. Serves as a data-driven foundation for competitor analysis, market entry strategy development, and investment decision-making, providing credible numerical support for strategic arguments.
-
How to Use
Add analysis context and insights in the left text area, then input actual data in the right graph section. The stacked bar structure expresses each item's proportion relative to the total, with precise figures recorded in the bottom table. Select one of the two background colors to match your presentation tone and style.
-
Recommended For
Ideal for presentations to marketing professionals, market analysts, executives, and investors. Applicable in pet industry, consumer goods, finance, and insurance sectors for expenditure comparison, market share analysis, and budget justification. Recommended for all business presentations requiring quantitative credibility and data visualization.
-
Slide Structure
2-slide set. Each slide features a left text area (title and description) and right data area (4-item horizontal stacked bar chart with 3-color gradient series plus bottom data table). Slide 1 uses dark navy background; Slide 2 uses light cyan background, presenting identical data with different visual contexts.
Related Products
-

Market Trend Analysis Graph & Table Chart – Insightful Data Visualization
#Market and Competitor Analysis #Diagram #Graph
-

Subdivided Bar Graph for Visual Market Analysis – Presenting Competitive Data Effectively
#Market and Competitor Analysis #Diagram #Graph
-

Market Growth Chart for Business Insights
#Market and Competitor Analysis #Diagram #Graph
-

Market Trend Analysis Graph & Table Chart
#Market and Competitor Analysis #Diagram #Graph
