Year Comparison 3D Line Graph – Competitor Analysis and Market Status
RM0100010_10
- Last Update 01/27/2025
- File Size 1MB
- # of Slides 2
- File Format PPTX
- Slide Ratio 16:9
- Color
Keywords
- #Content-Based Slides
- #Design-Based Slides
- #Market and Competitor Analysis
- #Graph
- #Other
- #Competitor Analysis
- #Market Analysis
- #16:9
- #market status 3D line graph
- #competitor analysis PowerPoint slide
- #year-over-year comparison PPT
- #data visualization graph slide
- #market analysis presentation template
About the Product
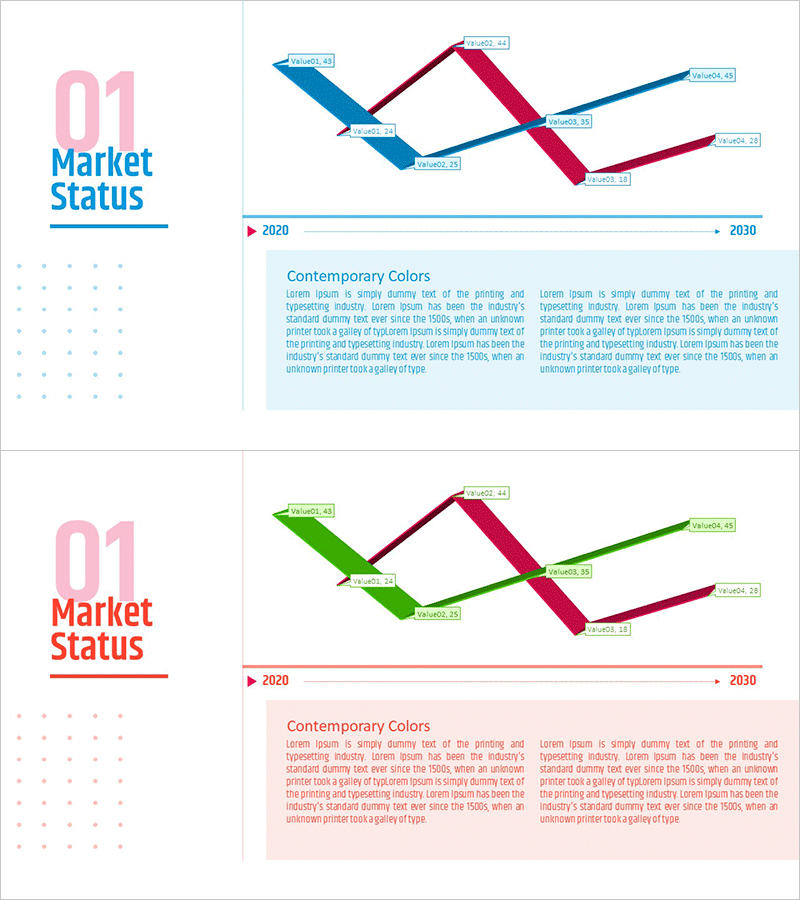
A professional PowerPoint slide featuring a 3D line graph visualizing market trends from 2020 to 2030. The design uses contrasting blue and magenta lines to compare competitor performance and market status at a glance, with data point labels for precise information delivery. Provided in 16:9 widescreen PPTX format, this slide is ready for immediate use in business plans, investor pitch decks, marketing presentations, and quarterly reports. The text area below the graph allows you to add market analysis insights and strategic commentary, enhancing the persuasive impact of your presentation.
Usage Points
-
Main Usage
This data visualization slide compares market performance and competitor metrics across years using a 3D line graph. The contrasting blue and magenta lines clearly illustrate competitive relationships and trend trajectories over time. It serves as a critical analytical tool for investors, executives, and marketing teams to support data-driven decision-making.
-
How to Use
Input your actual market data into the 3D graph area at the top of the slide, then add your market analysis findings and strategic insights in the 'Contemporary Colors' text box below. Customize the blue and magenta line colors to match your corporate brand identity, and update the data point values to create a tailored presentation asset.
-
Recommended For
Recommended for business plans, investor pitch decks, marketing strategy presentations, quarterly and annual business reports, and market analysis briefings. Particularly effective when presenting market size changes, competitor performance benchmarks, revenue trends, and time-series financial data. Ideal for finance, technology, manufacturing, and distribution sectors where data-driven insights are critical.
-
Slide Structure
The slide layout features a header section with section number ('01'), title ('Market Status'), and decorative underline on the left, a 3D line graph visualization area on the right, and a descriptive text box at the bottom. Two color variants are provided—one in blue tones and one in red/magenta tones—allowing you to select the version that best matches your presentation theme and corporate identity.
Related Products
-

Shopping Payment Comparison Hill Shape Graph – Essential Market Analysis Item
#Market and Competitor Analysis #Graph #Other
-

White Black Area Graph – Visualizing Market Analysis
#Market and Competitor Analysis #Graph #Other
-

Two Types of Area Graphs – Market and Competitor Analysis
#Market and Competitor Analysis #Graph #Other
-

Blue Green Area Graph – Suitable for Market Analysis
#Market and Competitor Analysis #Graph #Other
