Eco-farming Agriculture Future Outlook Vertical Bar Chart
RJ0600033_29
- Last Update 06/30/2025
- File Size 3MB
- # of Slides 2
- File Format PPTX
- Slide Ratio 16:9
- Color
Keywords
- #Content-Based Slides
- #Design-Based Slides
- #Market and Competitor Analysis
- #Financial Plans and Performance
- #Graph
- #Future Outlook
- #Sales and Revenue
- #Column
- #Grouped Column
- #16:9
- #clustered vertical bar chart PowerPoint
- #positive negative comparison slide
- #2-series bar graph template
- #agriculture market analysis chart
- #financial performance comparison PPT
About the Product
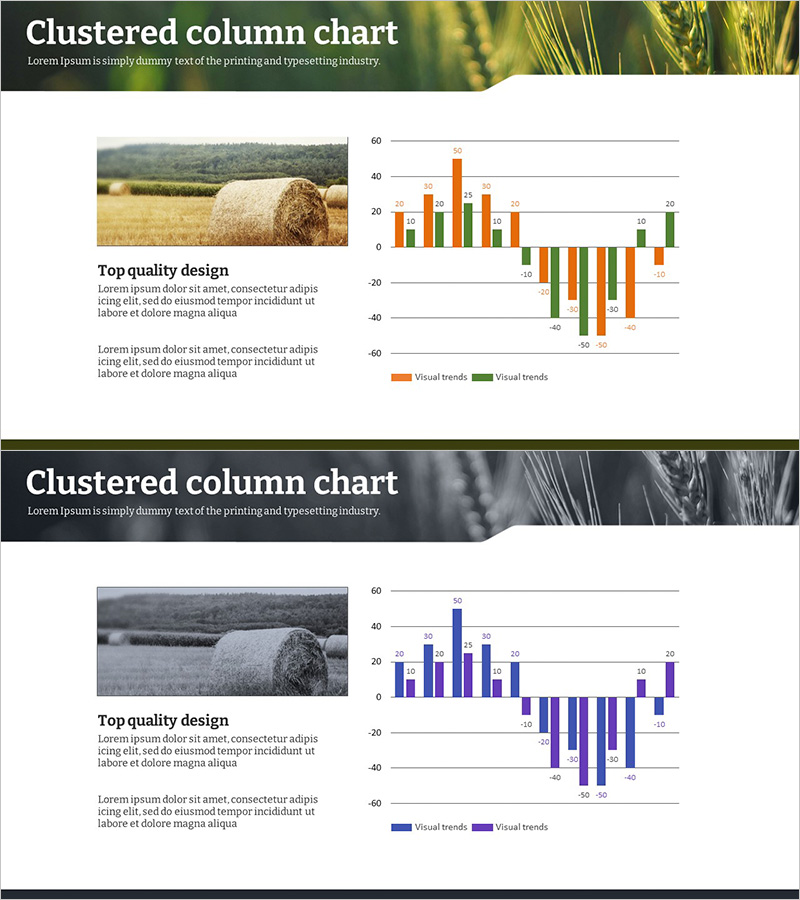
A clustered vertical bar chart PowerPoint slide designed to visualize eco-farming agriculture future outlook and market trends. The slide features two data series in orange and green colors, enabling simultaneous comparison of positive and negative values for agricultural market analysis, financial performance evaluation, and competitive benchmarking. Provided as 2 slides in 16:9 widescreen format, each slide includes chart area, image section, and text description space for immediate presentation use. This PowerPoint template effectively communicates numerical trends and comparative relationships in business reports and strategic presentations.
Usage Points
-
Main Usage
Visualizes positive and negative data comparison to communicate market trends, financial performance, and competitive positioning. Ideal for agriculture, environmental, and energy industry presentations to distinguish favorable and unfavorable factors in future outlook analysis.
-
How to Use
Insert into business plans, market analysis reports, or financial presentation slides in the 'Market & Competitive Analysis' or 'Financial Performance' section. Use bar height and color to differentiate data magnitude and series, and add key figures and interpretation in text areas to strengthen presentation narrative.
-
Recommended For
Recommended for agriculture and environmental company executive reports, investment pitch decks, market analysis consulting reports, and academic presentations. Suitable for strategic planning, performance evaluation, and market forecasting presentations requiring quantitative data comparison.
-
Slide Structure
Consists of 2 slides, each with title area at top, image section on left (agriculture-related photo), clustered vertical bar chart on right (orange and green 2-series, approximately 10 data points, positive-negative axis indicators), and legend with text description space at bottom.
Related Products
-

Energy Saving Future Outlook Vertical Bar Graph
#Market and Competitor Analysis #Financial Plans and Performance #Graph
-

Volume Presentation Template with Tables and Clustered Charts – Efficient Data Analysis
#Market and Competitor Analysis #Financial Plans and Performance #Diagram
-

Leather Material Map Template - Global Network Visualization
#Company Introduction #Financial Plans and Performance #Graph
-

Orange Green Profit and Loss Chart – Visualizing Revenue and Profit
#Financial Plans and Performance #Diagram #Graph
