Market Trends Comparison Graph – Emphasizing Technical Advantage
RJ0800036_6
- Last Update 08/10/2025
- File Size 0.3MB
- # of Slides 2
- File Format PPTX
- Slide Ratio 16:9
- Color
Keywords
- #Content-Based Slides
- #Design-Based Slides
- #Technical Approach
- #Market and Competitor Analysis
- #Graph
- #Future Development Roadmap
- #Competitive Advantage
- #Column
- #Column Chart
- #16:9
- #horizontal bar chart PowerPoint
- #market trends comparison slide
- #competitive analysis template
- #data comparison graph
- #bar chart slide design
About the Product
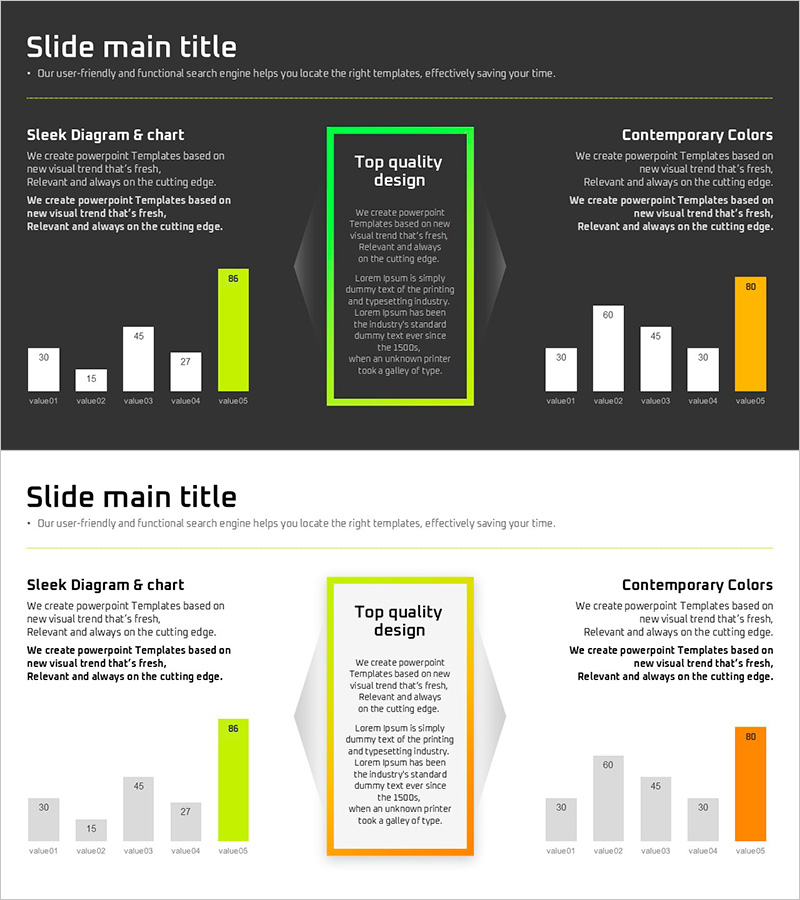
A horizontal bar chart PowerPoint slide for comparing market trends and technical advantages across five data points. The bars are arranged side-by-side on a dark background with neon yellow, lime green, and orange accent colors highlighting key performance metrics. A prominent text box emphasizes the main message, making this slide ideal for business proposals, competitive analysis reports, and strategic presentations. Fully editable and ready to use in market analysis, competitive positioning, and performance review sections.
Usage Points
-
Main Usage
Visualizes quantitative comparison data such as competitive performance, market share, pricing advantage, or technology metrics across five categories. The horizontal bar layout enables intuitive size comparison, while neon accent bars emphasize top performers or target benchmarks.
-
How to Use
Insert into business plans, investment pitch decks, or proposals in the market analysis or competitive advantage section. Double-click each bar value to edit numbers, and update legend text with competitor names or product titles. The dark background design ensures high readability in projector presentations.
-
Recommended For
Strategy, marketing, and sales professionals presenting competitive positioning. Suitable for technology comparison presentations, quarterly performance reports, new business proposals, and market analysis briefings.
-
Slide Structure
Two-slide layout. First slide features a 5-item horizontal bar chart (value01–value05) with left-aligned descriptive text. Second slide mirrors the structure with right-aligned text and a neon orange highlight box for key messaging. 16:9 widescreen format, PPTX file type.
Related Products
-

Orange Hexagon Presentation Template Vertical Bar Graph
#Market and Competitor Analysis #Financial Plans and Performance #Graph
-

Visualizing Plant Growing Market Size – Achievements and Competitive Edge
#Business Strategy #Market and Competitor Analysis #Graph
-

Car Wide Template Vertical Bar Graph – Market Analysis and Competitive Advantage
#Market and Competitor Analysis #Financial Plans and Performance #Graph
-

Explosive Growth Graph of Automotive Parts Services
#Business Strategy #Technical Approach #Graph
