Doughnut Chart Visualizing Market Share by Exercise
RJ0800031_7
- Last Update 08/08/2025
- File Size 1MB
- # of Slides 2
- File Format PPTX
- Slide Ratio 16:9
- Color
Keywords
- #Content-Based Slides
- #Design-Based Slides
- #Business Introduction
- #Market and Competitor Analysis
- #Graph
- #Other
- #Technological Status
- #Market Share
- #Circles
- #Doughnut Chart
- #Map
- #16:9
- #world map PowerPoint slide
- #regional market analysis presentation
- #global data visualization
- #geographic market share
- #map-based slide template
About the Product
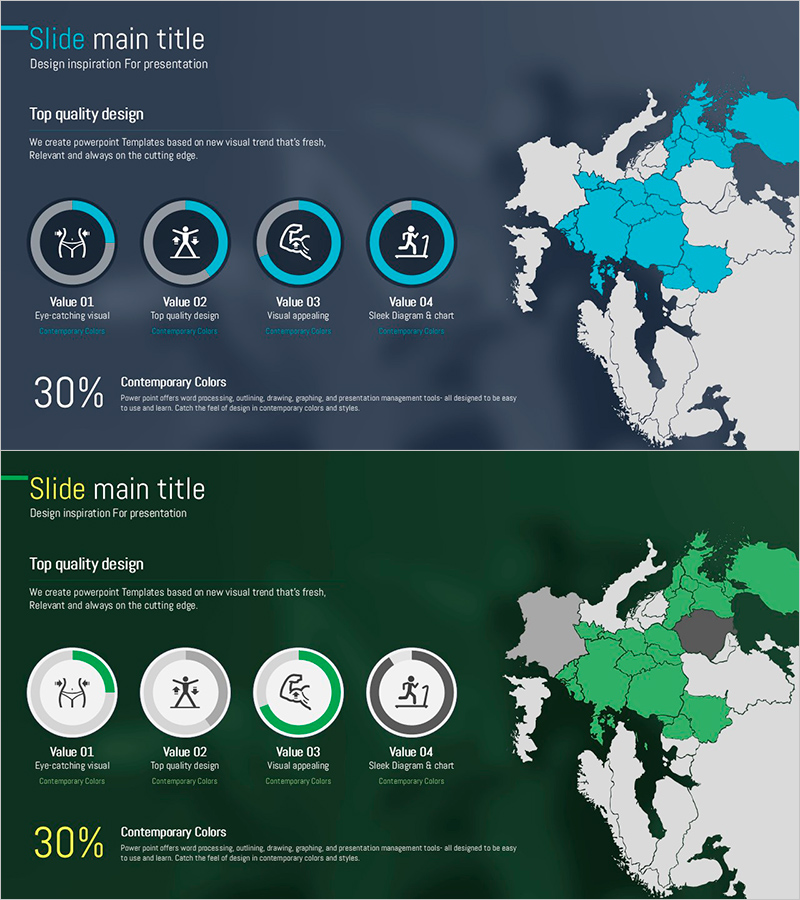
A 2-slide PowerPoint set visualizing regional market share using an interactive world map. Dark gray background with cyan and green accent regions highlights key markets and geographic data distribution. Each slide features four circular icon elements paired with key metrics and a prominent 30% data indicator for clear emphasis. Ideal for market analysis presentations, business reports, and investor pitches. Provided in 16:9 widescreen PPTX format with fully editable elements for customization.
Usage Points
-
Main Usage
Visualize global market distribution by region to communicate international business landscape at a glance. Color-coded map regions and numeric indicators clearly show market size differences across geographies, providing stakeholders, investors, and teams with evidence-based global strategy context.
-
How to Use
Deploy in market analysis sections of marketing plans, regional performance reviews in business reports, and global opportunity explanations in investor presentations. Customize map colors and icon labels to match your specific data, creating tailored slides that fit your presentation narrative.
-
Recommended For
Marketing professionals, business strategists, international sales teams, and executives presenting global market insights. Particularly valuable for multinational corporations, export-import departments, and organizations planning international expansion or market entry strategies.
-
Slide Structure
Two-slide layout with title area at top, left-side text region containing four circular icons with labels and prominent 30% metric highlight, and right-side world map with cyan/green accent regions and neutral gray/white areas. 16:9 widescreen format with fully editable components.
Related Products
-

Donut Chart in Overseas Markets – Market Share Analysis
#Market and Competitor Analysis #Graph #Other
-

Pie Chart for Data Comparison – Quality and Color
#Business Introduction #Market and Competitor Analysis #Graph
-

World Map and Share Chart for Market Analysis – Effective Data Visualization
#Market and Competitor Analysis #Graph #Other
-

Global Architectural Donut Chart – Market Share Visualization
#Market and Competitor Analysis #Graph #Other
