Motion Radar Chart for Effective Data Visualization
RJ0800031_17
- Last Update 08/08/2025
- File Size 0.7MB
- # of Slides 2
- File Format PPTX
- Slide Ratio 16:9
- Color
Keywords
About the Product
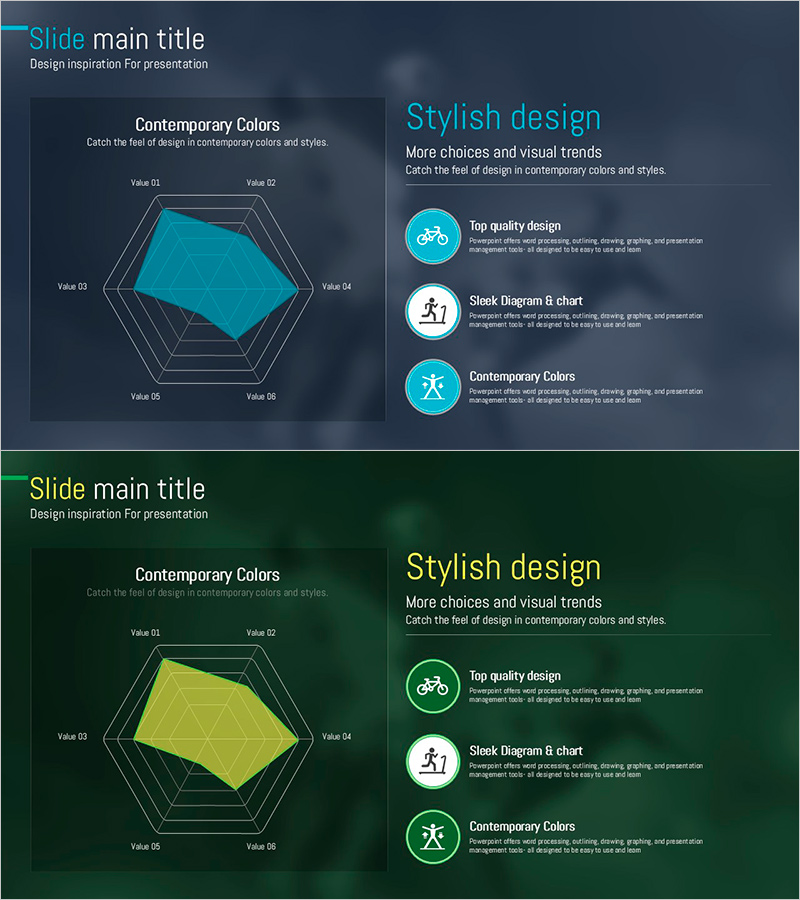
A professional PowerPoint slide featuring a 6-axis radial radar chart for comparing performance, competencies, and metrics across multiple dimensions. The cyan-filled data area contrasts sharply against the dark gray background and gridlines, making data points immediately visible. Each axis is labeled Value 01 through Value 06 for quantitative assessment. The 2-slide deck includes a title slide and chart slide, optimized for 16:9 widescreen format. Perfect for organizational capability assessments, product performance comparisons, individual skill evaluations, and strategic presentations requiring multi-dimensional data visualization.
Usage Points
-
Main Usage
Simultaneously compare organizational, individual, or product performance across six dimensions using a radial radar chart. This visualization format instantly reveals relative strengths and weaknesses, making it ideal for capability assessments, performance analysis, competitive benchmarking, and product specification comparisons.
-
How to Use
Start with the title slide to introduce your analysis topic, then use the radar chart slide to input values for each of the six axes. The cyan-filled area represents your data while gray gridlines serve as reference benchmarks. Customize axis labels to reflect organizational competencies, product features, personal skills, or any six-point comparison framework.
-
Recommended For
Executives, team leads, and project managers presenting organizational capabilities, team performance, and individual development plans. Marketing, sales, and HR professionals analyzing competitive positioning, product differentiation, and talent evaluation. Suitable for investor presentations, business plans, performance reports, and any document requiring quantitative multi-dimensional comparison.
-
Slide Structure
Slide 1: Title slide with cyan accent text and subtitle. Slide 2: 6-axis radial radar chart with cyan-filled data area and dark gray gridlines, each axis labeled Value 01–06. Right panel contains three circular icon elements (bicycle, running figure, stretching pose) with accompanying text blocks: Top quality design, Sleek Diagram & chart, Contemporary Colors.
Related Products
-

Radar Chart for Supplements Presentation
#Product/Service Introduction #Graph #Features
-

Premium Design Infographic – Top Quality
#Product/Service Introduction #Graph #Features
-

Natural Radial Chart – Visualizing Business and Service Attributes
#Product/Service Introduction #Diagram #Graph
-

Natural Environment Radar Chart – Emphasizing Vitality and Harmony
#Product/Service Introduction #Graph #Features
