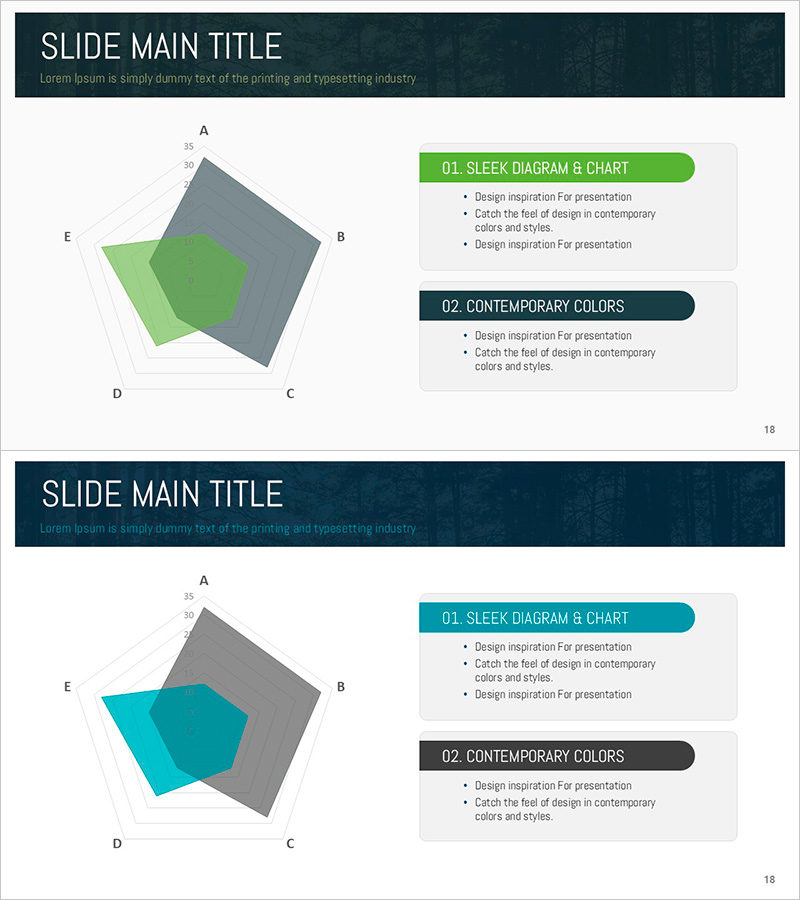
Natural Radial Chart – Visualizing Business and Service Attributes
RJ0600087_18
- Last Update 07/14/2025
- File Size 3.5MB
- # of Slides 2
- File Format PPTX
- Slide Ratio 16:9
- Color
Keywords
- #Content-Based Slides
- #Design-Based Slides
- #Product/Service Introduction
- #Diagram
- #Graph
- #Text Box
- #Features
- #Composition
- #Other
- #Radar Chart Spider Chart
- #Rectangle Text Box
- #16:9
- #radial chart PowerPoint
- #radial diagram slide template
- #5-node chart design
- #business attribute analysis PPT
- #product characteristic visualization
- #graph PowerPoint slide
About the Product
A 2-slide PowerPoint set featuring a 5-node radial chart design for visualizing business and service attributes. The radial structure radiates from a central concept outward to five directions, enabling clear comparison and analysis of product or service characteristics. The green accent color combined with gray base creates a professional, trustworthy atmosphere suitable for business presentations. Each slide includes accompanying text description areas, making it ready to use in product introductions, marketing plans, sales decks, and corporate reports. Delivered in 16:9 widescreen PPTX format, fully editable in all modern PowerPoint versions.
Usage Points
-
Main Usage
Optimized for comparing and visualizing five key aspects of a product or service simultaneously. The radial structure emanating from a central point clearly expresses hierarchical relationships and interconnections, making it ideal for business attribute analysis, competitive comparisons, capability assessments, and multi-dimensional analytical presentations.
-
How to Use
The first slide displays the radial chart standalone; the second includes text description areas to the right. Click on each node to edit text or modify colors to differentiate categories. Choose the layout that best fits your presentation context and customize the content accordingly.
-
Recommended For
Recommended for product development teams, marketing professionals, sales presentations, executive reports, and consulting proposals. Particularly effective when comparing five or more attributes simultaneously, such as service features, technical capabilities, market positioning, or organizational roles.
-
Slide Structure
2-slide composition. Slide 1: Radial chart with five nodes radiating from a central point in standalone layout. Slide 2: Identical radial chart on the left with two text sections (title and description areas) on the right. All elements unified in green accent and gray base colors.
Related Products
-

Characteristic Diagram – Product and Service Introduction
#Product/Service Introduction #Diagram #Features
-

Diet Table for Weight Control – Healthy Choices
#Product/Service Introduction #Diagram #Features
-

Network Firewall Service Features and Configuration
#Product/Service Introduction #Diagram #Features
-

Idea Development Composition – Cluster Diagram
#Product/Service Introduction #Diagram #Features
