Natural Environment Radar Chart – Emphasizing Vitality and Harmony
RJ0600091_18
- Last Update 07/15/2025
- File Size 1.1MB
- # of Slides 2
- File Format PPTX
- Slide Ratio 16:9
- Color
Keywords
About the Product
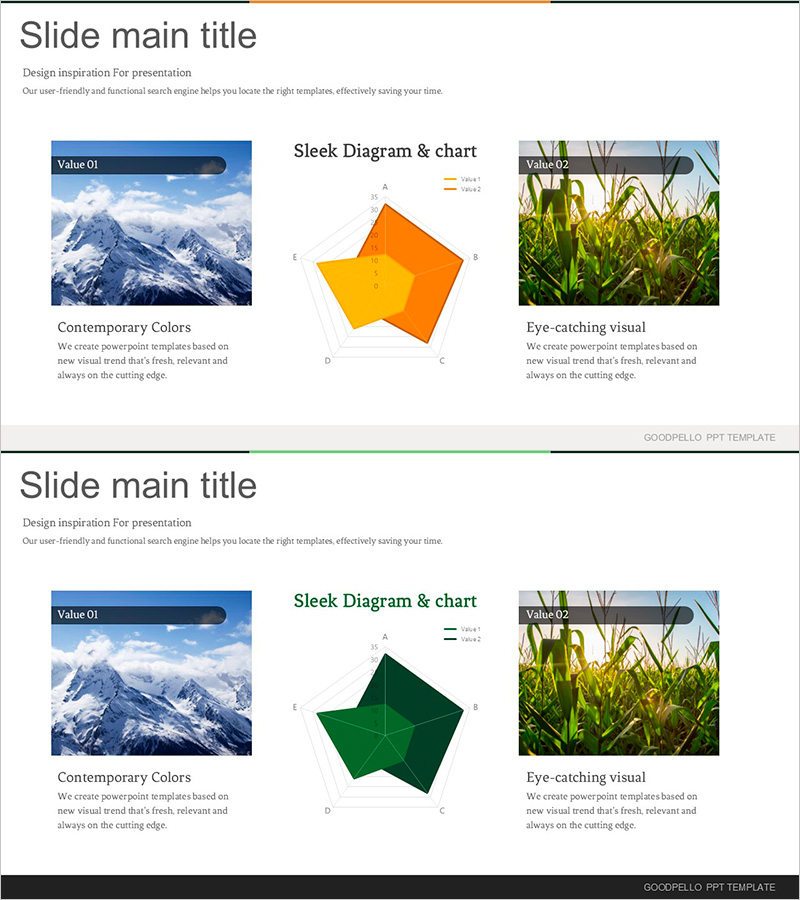
A 2-slide PowerPoint set featuring 5-axis radar charts (spider diagrams) that express vitality and harmony of natural environments. The first slide uses orange-yellow gradient tones to emphasize warm energy, while the second slide employs deep green to convey natural stability. Input data values on each axis to visualize comparative analysis of five dimensions, ideal for industry, environmental, and sustainability presentations. Available in 16:9 widescreen PPTX format, fully editable in all presentation software.
Usage Points
-
Main Usage
Visualize multidimensional data comparison across five categories using a radar chart format. Perfect for environmental metrics, sustainability goals, competency assessments, and market analysis. The natural environment theme with warm and stable color tones supports credible and professional presentations.
-
How to Use
Enter category names on each axis (A, B, C, D, E) and modify the legend data series to reflect your values. Use the orange version for presentations emphasizing energy, growth, and activity; use the green version for stability, trust, and sustainability messaging. Colors and data ranges are fully customizable.
-
Recommended For
Environmental and energy sector presentations, agricultural and forestry industry reports, sustainability development initiatives, business competency evaluations, market competitive analysis, university research presentations, government and NGO policy reports, and corporate environmental impact assessments.
-
Slide Structure
2-slide set. Slide 1: Orange-yellow gradient 5-axis radar chart with 2-series legend and text area. Slide 2: Deep green 5-axis radar chart with 2-series legend and text area. Both slides include title, subtitle, and descriptive text boxes for customization.
Related Products
-

Natural Radial Chart – Visualizing Business and Service Attributes
#Product/Service Introduction #Diagram #Graph
-

Premium Design Infographic – Top Quality
#Product/Service Introduction #Graph #Features
-

Motion Radar Chart for Effective Data Visualization
#Product/Service Introduction #Graph #Features
-

Radar Chart for Supplements Presentation
#Product/Service Introduction #Graph #Features
