Radar Chart for Supplements Presentation
RJ0800024_21
- Last Update 08/06/2025
- File Size 1MB
- # of Slides 2
- File Format PPTX
- Slide Ratio 16:9
- Color
Keywords
About the Product
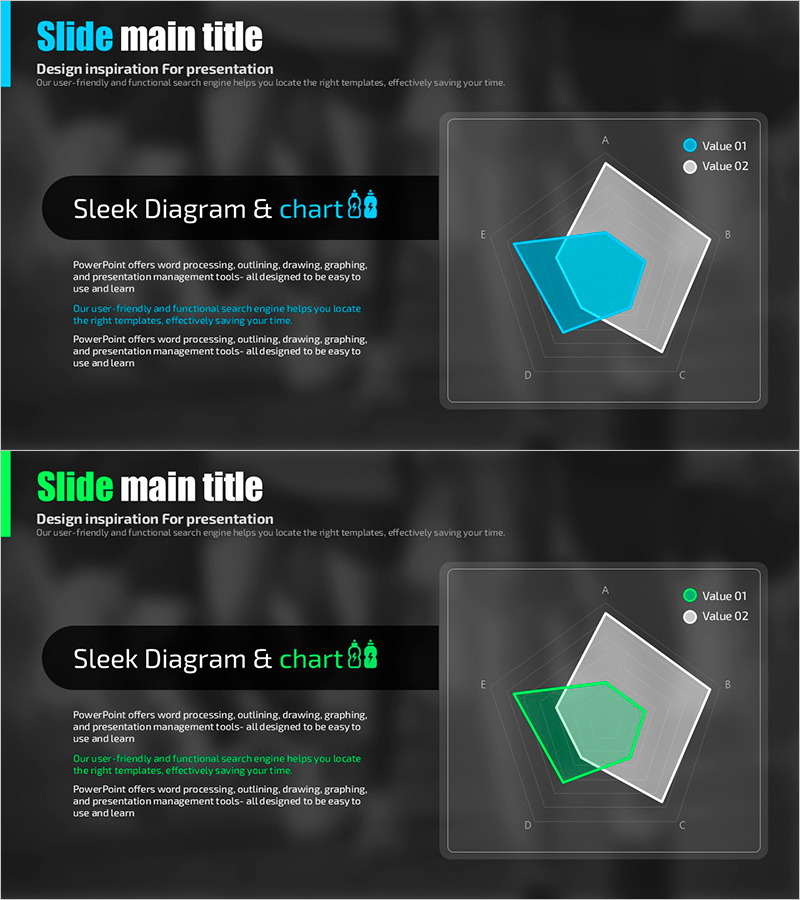
A 5-point radial radar chart PowerPoint slide designed for supplement and nutritional product analysis. Set against a dark gray background with cyan and green transparent fill areas, this template visualizes data comparison across five dimensions. The 2-slide set includes color variations (cyan and green versions) to match your presentation theme or brand identity. Simply input axis labels and adjust data points to create professional product comparison presentations for supplements, vitamins, and health products.
Usage Points
-
Main Usage
Compare and analyze supplement ingredients, nutritional content, and product features across five key dimensions using a radial structure. This chart enables quick visual assessment of relative strengths and is ideal for product presentations, marketing materials, and nutritional consulting.
-
How to Use
Enter axis labels (e.g., protein, vitamins, minerals, absorption rate, value) and drag the transparent polygon vertices to adjust data values. Choose between cyan or green color versions to represent competitive products or show changes over time.
-
Recommended For
Nutritionists, health product marketers, pharmaceutical sales teams, fitness coaches, and healthcare professionals presenting product characteristics, ingredient advantages, and efficacy comparisons. Perfect for supplement catalogs, product brochures, and health seminar materials.
-
Slide Structure
5-point radial configuration with five data axes arranged symmetrically. Each slide features transparent fill areas (cyan or green) representing data values, with legend indicators (Value 01, Value 02). The 2-slide set provides color variations for comparative analysis and multi-dataset visualization.
Related Products
-

Premium Design Infographic – Top Quality
#Product/Service Introduction #Graph #Features
-

Natural Environment Radar Chart – Emphasizing Vitality and Harmony
#Product/Service Introduction #Graph #Features
-

Natural Radial Chart – Visualizing Business and Service Attributes
#Product/Service Introduction #Diagram #Graph
-

Motion Radar Chart for Effective Data Visualization
#Product/Service Introduction #Graph #Features
