Brown Yellow Regional Analysis – Market Share Visualization
RJ0800030_26
- Last Update 08/08/2025
- File Size 3.7MB
- # of Slides 2
- File Format PPTX
- Slide Ratio 16:9
- Color
Keywords
About the Product
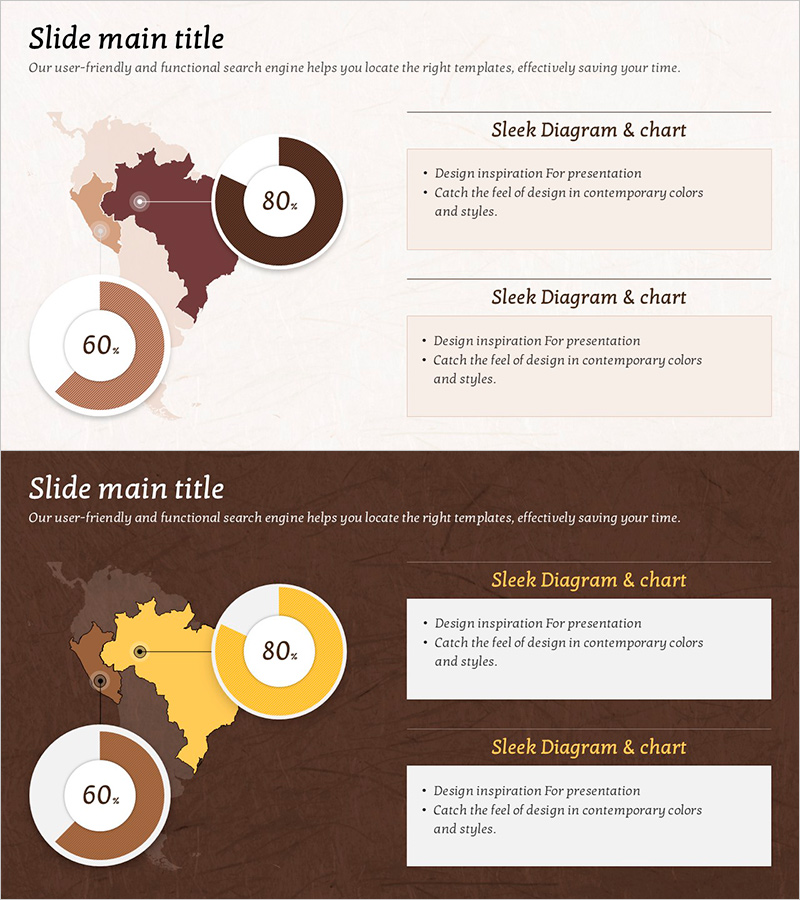
A donut chart PowerPoint slide designed for regional analysis and market share visualization. Featuring warm brown and yellow tones, this slide displays two donut graphs overlaid on a regional map, with percentage values (80%, 60%) centered in each chart. Text boxes on the right side provide space for detailed descriptions and insights. Ideal for business presentations, market analysis reports, sales performance reviews, and regional strategy discussions. Fully editable and ready to use in any professional presentation.
Usage Points
-
Main Usage
Visualize regional market share, sales distribution, customer concentration, and geographic performance metrics using donut charts. The centered percentage values provide clear data representation for decision-making and strategic planning.
-
How to Use
Input actual data into the two donut charts positioned on the map, and add regional analysis details in the text boxes on the right. Colors and percentages are fully editable. Duplicate the donut charts to add more regions as needed.
-
Recommended For
Marketing managers, sales directors, regional strategy planners, market research analysts, and business development teams presenting regional performance, sales reports, and market expansion strategies.
-
Slide Structure
Title area at top, two donut charts with percentage values (80%, 60%) on regional map background (left side), two text boxes for descriptions (right side). 16:9 aspect ratio, 2-slide set.
Related Products
-

Mokup and Turnout Analysis Chart – Analyze with Visual Data
#Market and Competitor Analysis #Graph #Other
-

Space Exploration Donut Pie Chart
#Product/Service Introduction #Market and Competitor Analysis #Graph
-

Donut Chart Slide Visualizing Target Market Development Status
#Market and Competitor Analysis #Graph #Other
-

Analysis of Target Market Construction Status – Data Visualization Tool
#Market and Competitor Analysis #Graph #Other
