Brown Yellow Schematic and Table – Visualizing Financial Plans
RJ0800030_25
- Last Update 08/08/2025
- File Size 3.6MB
- # of Slides 2
- File Format PPTX
- Slide Ratio 16:9
- Color
Keywords
- #Content-Based Slides
- #Design-Based Slides
- #Technical Approach
- #Financial Plans and Performance
- #Diagram
- #Service Architecture Diagram
- #Key Financial Indicators
- #Structure
- #Table
- #Tree Diagram
- #16:9
- #tree diagram PowerPoint
- #hierarchical structure slide template
- #financial planning diagram
- #organizational chart PPT
- #3-level flowchart slide
- #brown yellow diagram PowerPoint
About the Product
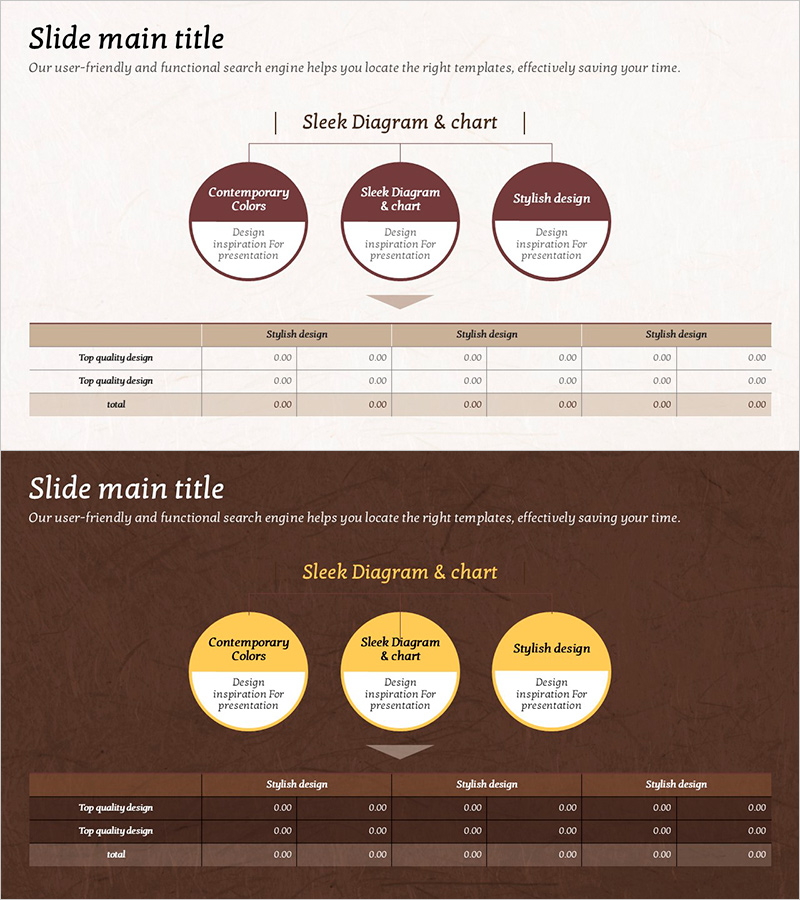
A 3-level tree diagram PowerPoint slide designed to visualize financial planning and organizational hierarchies. The dual-tone brown and yellow color scheme creates a professional appearance while clearly showing hierarchical relationships from parent to child nodes. An accompanying data table provides structured numerical information to reinforce presentation credibility. This 2-slide set is ready to use immediately, with fully editable shapes allowing you to customize node labels and table values for your specific financial or organizational context.
Usage Points
-
Main Usage
Effectively communicate hierarchical relationships such as financial structures, budget allocation, organizational hierarchies, and decision-making processes. The visual tree layout helps audiences quickly grasp multi-level concepts and understand how components relate to each other.
-
How to Use
Ideal for financial reports, business plans, organizational restructuring presentations, and strategic planning meetings. Use the diagram to explain budget breakdowns or department structures, and pair it with the data table to present both qualitative relationships and quantitative metrics simultaneously.
-
Recommended For
Finance professionals, CFOs, executives, strategic planning teams, organizational development specialists, and management consultants presenting budget structures, org charts, or process hierarchies. Suitable for internal corporate meetings and external investor presentations alike.
-
Slide Structure
Slide 1: Tree diagram with 3 nodes on brown background—one parent node (yellow circle) connected to two child nodes (yellow circles), showing clear hierarchical flow. Slide 2: Data table with brown header row and beige data rows, 6 columns × 3 data rows for numerical input.
Related Products
-

Origami Concept Table – Visualizing Financial Performance
#Financial Plans and Performance #Diagram #Balance Sheet
-

Liquor Industry Financial Indicators – Effective Data Visualization
#Financial Plans and Performance #Diagram #Cash Flow Statement
-

Analysis Table by Main Task – Financial Planning and Performance
#Business Management #Financial Plans and Performance #Diagram
-

Key Financial Indicators by Year – Insights for Financial Analysis
#Financial Plans and Performance #Diagram #Sales and Revenue
