Road Bar Chart for Transportation Utilization
RJ0800030_21
- Last Update 08/08/2025
- File Size 4.2MB
- # of Slides 2
- File Format PPTX
- Slide Ratio 16:9
- Color
Keywords
- #Content-Based Slides
- #Design-Based Slides
- #Market and Competitor Analysis
- #Graph
- #Industry Trends
- #Horizontal Bar
- #Segmented Horizontal Bar
- #16:9
- #horizontal bar chart PowerPoint
- #transportation utilization slide
- #year-over-year comparison template
- #data visualization chart
- #how to create bar chart in PowerPoint
About the Product
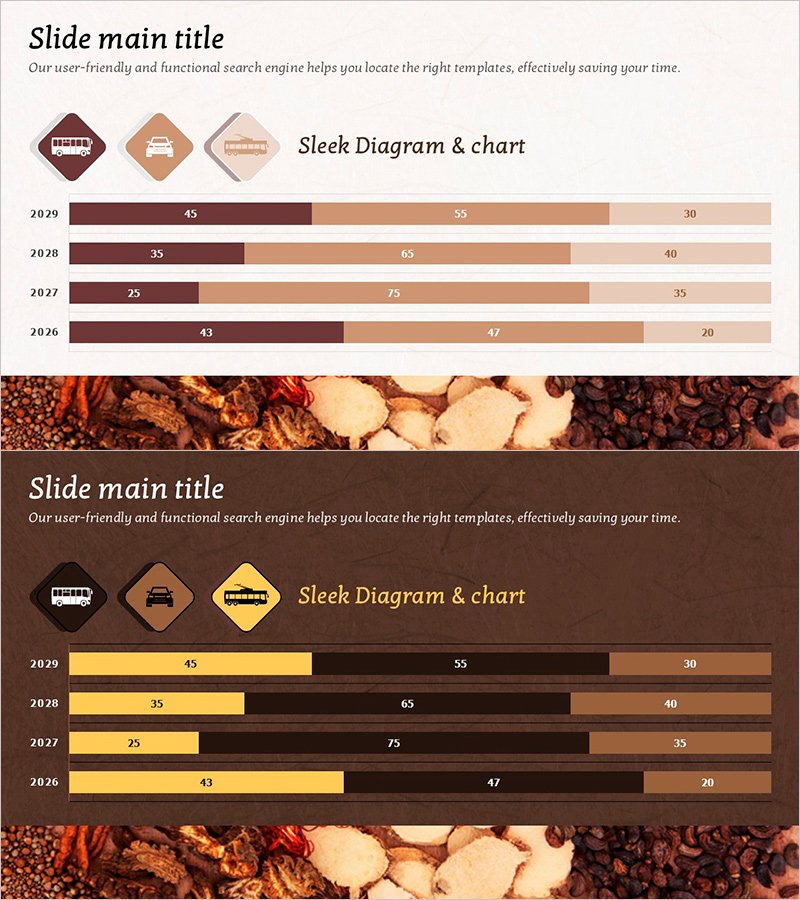
A horizontal bar chart PowerPoint slide comparing transportation mode utilization rates across four years (2026–2029). The slide visualizes three data series (bus, car, train) in a dark brown, beige, and light brown color palette, enabling clear year-over-year comparison and trend analysis. Designed for business presentations, market analysis, transportation policy reports, and statistical presentations, this slide template allows immediate customization with your own data while maintaining professional visual hierarchy and readability.
Usage Points
-
Main Usage
This slide effectively visualizes transportation mode utilization changes across multiple years, enabling stakeholders to quickly identify trends and compare performance metrics. The horizontal bar layout makes it easy to read category labels and compare values across time periods, making it ideal for policy briefs, business reports, and academic presentations where data-driven decision-making is critical.
-
How to Use
Simply replace the existing data values with your own figures, and the chart automatically updates while maintaining the professional color scheme and layout. The template supports easy editing of year labels, category names, and numerical values in PowerPoint's native chart editor. You can also adjust colors to match your organization's branding guidelines without affecting the overall design structure.
-
Recommended For
Transportation planners, urban development professionals, tourism boards, logistics companies, market research analysts, policy makers, and academic presenters. Particularly effective for government reports, business strategy presentations, quarterly performance reviews, and research seminars where multi-year trend analysis is essential for stakeholder communication.
-
Slide Structure
Two-slide set featuring horizontal bar charts for years 2026–2029. The first slide uses a light background with dark brown, beige, and light brown bars; the second employs a dark brown background with yellow, dark brown, and beige accents for emphasis. Each bar includes numerical labels for precise data representation and professional appearance.
Related Products
-

Bar Chart for Eco-friendly Practices Trends Visualization
#Market and Competitor Analysis #Graph #Industry Trends
-

Visualizing Camping Business Market Share with Bar Chart
#Market and Competitor Analysis #Graph #Industry Trends
-

Animal Natural Environment Improvement Rate Future Outlook Horizontal Bar Chart
#Market and Competitor Analysis #Graph #Industry Trends
-

Paint Piano and Segmentation Bar Graph – Market Trend Analysis
#Market and Competitor Analysis #Graph #Market Analysis
