Brown Segmentation Bar Graph – Clear Market Trends
RJ0800030_20
- Last Update 08/08/2025
- File Size 3.6MB
- # of Slides 2
- File Format PPTX
- Slide Ratio 16:9
- Color
Keywords
- #Content-Based Slides
- #Design-Based Slides
- #Market and Competitor Analysis
- #Graph
- #Industry Trends
- #Column
- #Segmented Column
- #16:9
- #segmented bar chart PowerPoint
- #stacked bar graph template
- #market trend chart slide
- #multi-category comparison PowerPoint
- #brown bar graph template
- #year-over-year trend comparison slide
About the Product
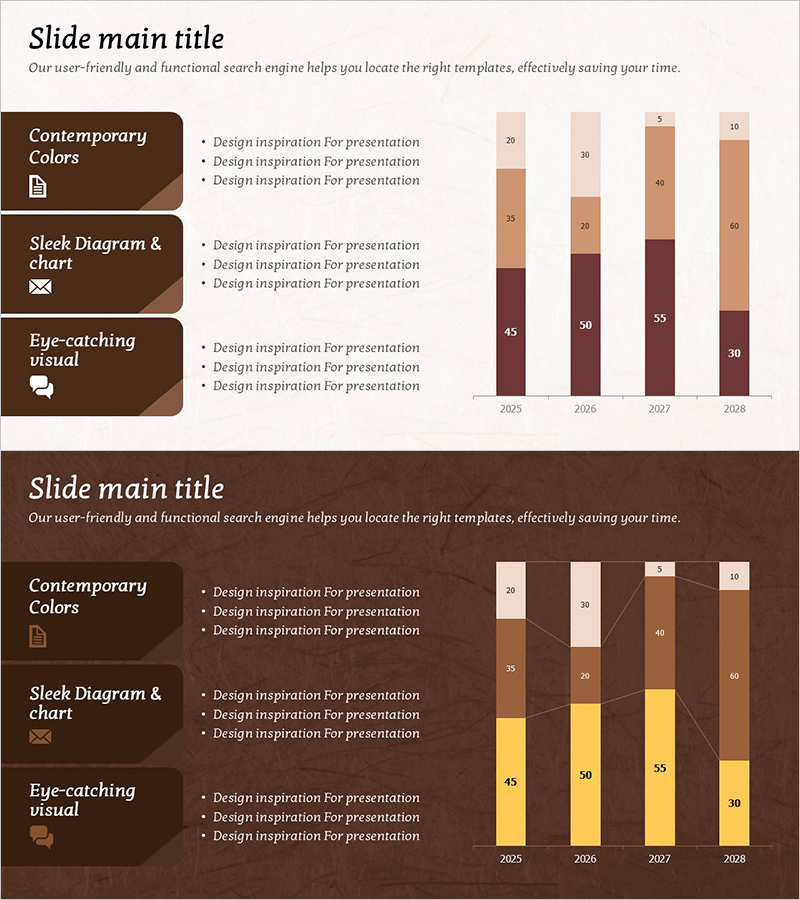
A segmented vertical bar chart PowerPoint slide visualizing market trends from 2025 to 2028 across four consecutive years. The slide features a brown, beige, and yellow color palette with multi-segment bars designed for comparing multiple data categories per year. The upper section includes three text boxes highlighting design features: contemporary colors, sleek diagram and chart design, and eye-catching visuals. Each bar displays clear numerical labels for precise data interpretation. This presentation slide is ready to use in marketing reports, business analysis documents, and market research presentations.
Usage Points
-
Main Usage
Enables side-by-side comparison of multi-dimensional data across years and categories, making complex market trends immediately understandable. Color-coded segments clarify compositional ratios and support intuitive interpretation of compound datasets.
-
How to Use
Insert into the market analysis section of marketing reports, performance forecast pages of business plans, or quarterly and annual results presentations. Double-click numerical labels to replace with actual data; colors and legend are fully editable to match your brand guidelines.
-
Recommended For
Marketing professionals, business analysts, financial reporting specialists, and consultants presenting market trends, sales performance, or customer segmentation data. Ideal when comparing 3–4 categories across multiple years or time periods.
-
Slide Structure
Two slides featuring stacked vertical bar charts, each displaying four years (2025–2028) of data segmented into 3–4 color categories. Three text boxes at the top describe design features; each bar includes numerical labels for data clarity and precision.
Related Products
-

Analyzing Future Prospect Graphs
#Market and Competitor Analysis #Diagram #Graph
-

Key Messages on a Vertical Cumulative Chart
#Business Vision and Strategy #Market and Competitor Analysis #Diagram
-

Segmented Vertical Bar Graph Blue Yellow – Customer Analysis and Market Trends
#Market and Competitor Analysis #Graph #Customer Analysis
-

Pork Consumption Stack Chart – Market Trend Analysis
#Market and Competitor Analysis #Graph #Market Analysis
