Visualizing Percentage of Product Sales by Period with Bar Charts – Market and Revenue Analysis
RJ0900027_20
- Last Update 08/24/2025
- File Size 0.3MB
- # of Slides 2
- File Format PPTX
- Slide Ratio 16:9
- Color
Keywords
- #Content-Based Slides
- #Design-Based Slides
- #Market and Competitor Analysis
- #Financial Plans and Performance
- #Graph
- #Industry Trends
- #Sales and Revenue
- #Column
- #Segmented Column
- #16:9
- #horizontal stacked bar chart PowerPoint
- #sales share visualization slide
- #period comparison chart
- #financial analysis graph PPT
- #how to create stacked bar chart in PowerPoint
About the Product
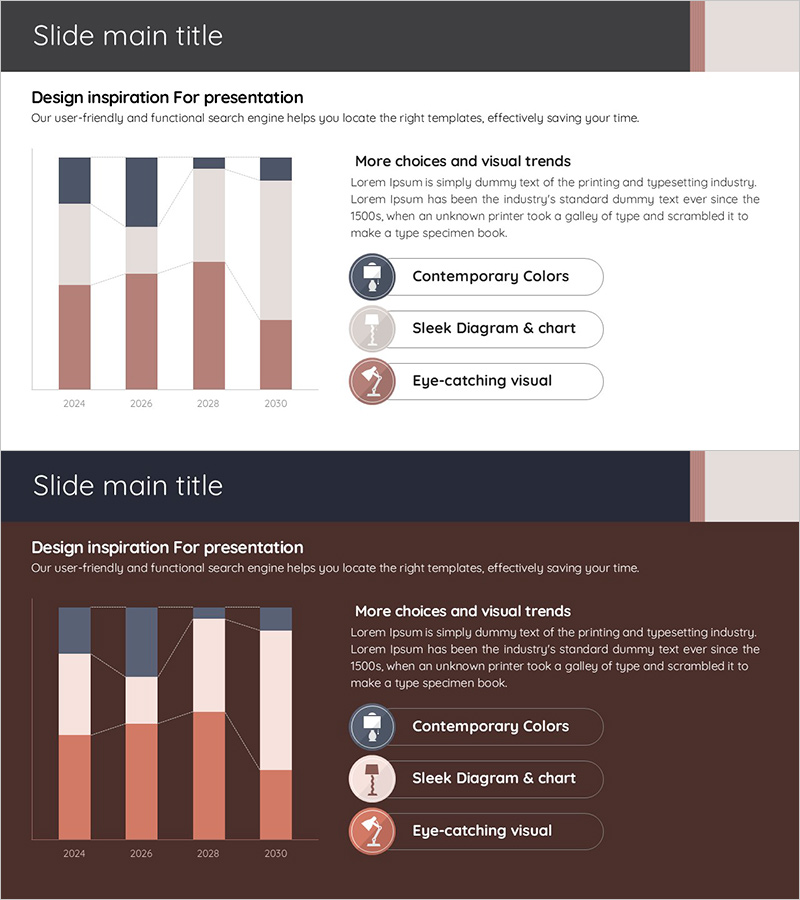
A PowerPoint slide that visualizes product sales share by period using a 4-item stacked horizontal bar chart. Data from 2024 to 2030 is represented in a three-color palette of dark blue, terracotta, and beige, allowing year-over-year revenue composition ratios to be compared at a glance. This presentation template is ready for immediate use in financial performance presentations, market research reports, and business analysis materials, making it essential for data-driven decision-making presentations.
Usage Points
-
Main Usage
Used to compare and analyze product sales share or revenue composition by year or period through a stacked horizontal bar chart. It simultaneously displays partial ratios and total sums of multiple items, clearly communicating market share, revenue diversification, and portfolio composition.
-
How to Use
Place this slide in the revenue analysis section of financial reports, market outlook pages of business plans, or performance analysis slides in investor pitch decks. When actual data is entered, the chart automatically updates, making iterative revisions easy.
-
Recommended For
CFOs and finance managers, marketing strategists, business development professionals, consultants, and presenters addressing investors typically use this slide. It is applicable in various business contexts such as quarterly and annual performance comparisons, product line revenue composition, and regional revenue analysis.
-
Slide Structure
Composed of 2 slides, each displaying a 4-item stacked horizontal bar chart (2024, 2026, 2028, 2030). Data is represented in layered dark blue, terracotta, and beige colors, with three key features—contemporary colors, clean diagram design, and eye-catching visuals—positioned on the right with accompanying icons.
Related Products
-

Hologram Wide PPT Table & Segmentation Bar Graph – Trendy Data Visualization
#Market and Competitor Analysis #Financial Plans and Performance #Diagram
-

Structure Presentation Template Segmented Vertical Bar Graph – Market Trends and Performance Analysis
#Market and Competitor Analysis #Financial Plans and Performance #Diagram
-

Horizontal Bar Chart Visualizing Herb Tea Sales Trends
#Market and Competitor Analysis #Financial Plans and Performance #Graph
-

Curved Theme Purple Template Segmentation Bar Graph
#Market and Competitor Analysis #Financial Plans and Performance #Graph
