Blue Orange Bundle Vertical Graph – Market and Competitor Analysis
RJ0500030_8
- Last Update 06/15/2025
- File Size 0.1MB
- # of Slides 2
- File Format PPTX
- Slide Ratio 16:9
- Color
Keywords
- #Content-Based Slides
- #Design-Based Slides
- #Market and Competitor Analysis
- #Graph
- #Competitor Analysis
- #Competitive Advantage
- #Column
- #Grouped Column
- #16:9
- #grouped vertical bar chart PowerPoint
- #multi-series graph template
- #market comparison slide
- #competitor analysis chart
- #4-year trend PowerPoint
About the Product
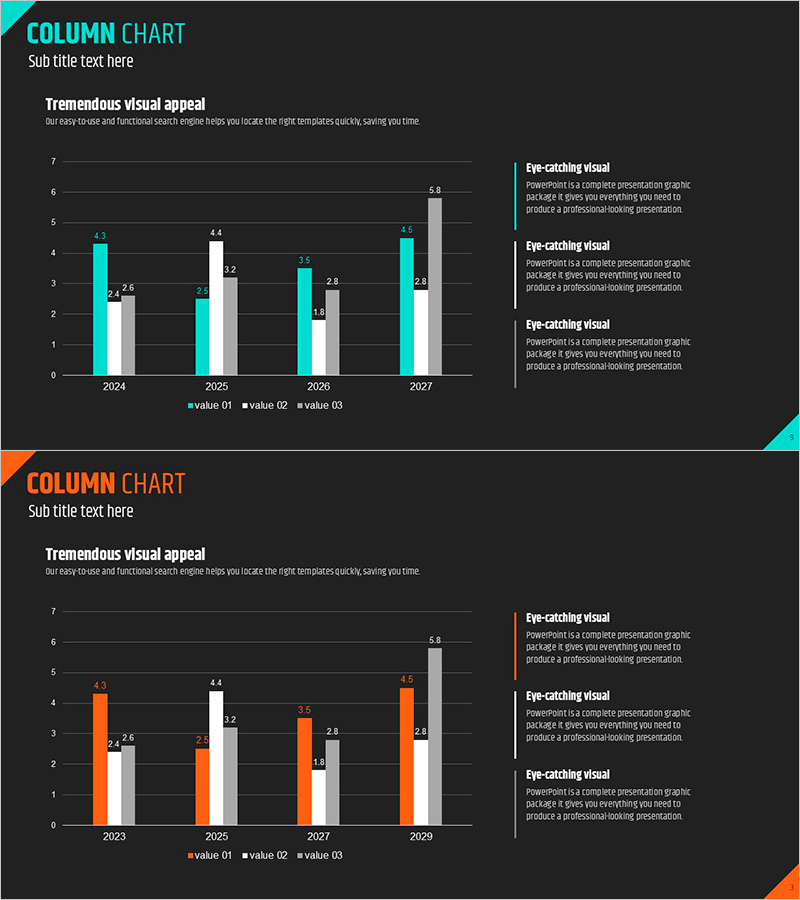
A grouped vertical bar chart PowerPoint slide comparing market data across 4 years (2024–2027) with 3 data series. Built on a dark gray background with cyan, orange, and white bar colors, this slide is optimized for competitor analysis, market forecasting, and revenue trend visualization. Each year displays clear numerical labels, and three 'eye-catching visual' text boxes on the right highlight key insights. Fully editable PPTX format ready for immediate use.
Usage Points
-
Main Usage
Visualize multi-dimensional data by comparing values across years and categories simultaneously. The 3-series bars enable side-by-side comparison of company performance, competitor metrics, and market benchmarks in a single, easy-to-read format.
-
How to Use
Ideal for business plans, investor pitch decks, quarterly earnings reports, and market analysis presentations. Replace bar heights and numerical labels with actual data to instantly communicate competitive positioning and growth trajectories.
-
Recommended For
Strategy planners, marketing managers, sales executives, financial analysts, and consultants requiring data-driven presentations. Perfect for startup investor pitches, corporate business reviews, and market research presentations.
-
Slide Structure
Dark gray background with 2-axis coordinate system: X-axis showing 4 years (2024–2027), Y-axis ranging 0–7. Each year contains 3 grouped bars (cyan, orange, white) representing 12 total data points. Right side includes 3 text box areas for inserting key messages and insights.
Related Products
-

Analyzing 2 Comparison Graphs - Slides for Deriving Competitive Advantage
#Market and Competitor Analysis #Graph #Competitor Analysis
-

Market Competition: Deep Dive into Top 3 Firms
#Market and Competitor Analysis #Graph #Competitor Analysis
-

Bar Chart Visualizing Freight Transport Trends – Essential Market Analysis Tool
#Market and Competitor Analysis #Graph #Text Box
-

Competitiveness Table and Chart Analysis – Market and Competitor Analysis
#Market and Competitor Analysis #Diagram #Graph
