Competition Green Graph – Emphasizing Competitive Advantage
RJ0500027_24
- Last Update 06/14/2025
- File Size 0.9MB
- # of Slides 2
- File Format PPTX
- Slide Ratio 16:9
- Color
Keywords
- #Content-Based Slides
- #Design-Based Slides
- #Market and Competitor Analysis
- #Graph
- #Competitor Analysis
- #Competitive Advantage
- #Column
- #Grouped Column
- #16:9
- #clustered column chart PowerPoint
- #competitive comparison slide template
- #4-category data comparison graph
- #teal lime chart PowerPoint
- #how to create comparison chart in PowerPoint
About the Product
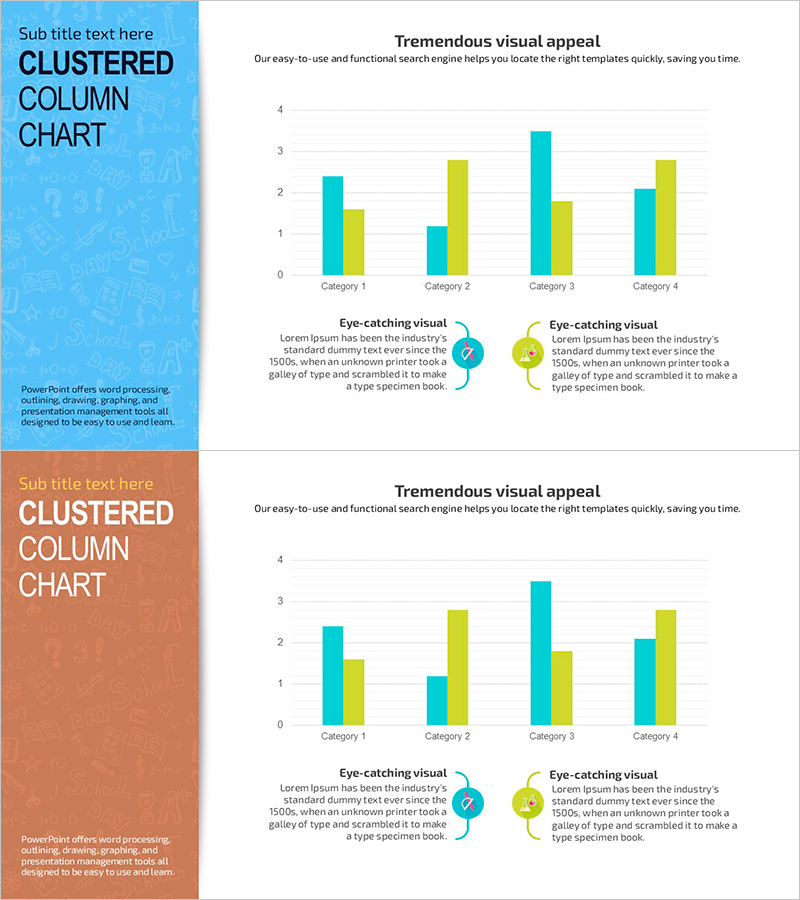
A clustered column chart PowerPoint slide designed to emphasize competitive advantage through side-by-side data comparison. The slide features teal and lime-colored bars across four categories, enabling clear visual representation of numerical differences. Two circular icons with text callouts highlight key messages below the chart. The 16:9 PPTX format with 2 slides allows immediate editing and deployment in presentations.
Usage Points
-
Main Usage
This slide presents quantitative competitive positioning by displaying multiple data series side-by-side. The clustered column structure is ideal for executive reports, investor pitch decks, and marketing strategy presentations where comparative analysis of competitive advantages is essential.
-
How to Use
Replace the four category labels and bar heights with your actual data values. Retain or customize the teal and lime colors to match your corporate branding. Edit the circular icon text to reflect your key competitive differentiators or messaging points.
-
Recommended For
Business development teams, marketing departments, sales executives, and C-suite presenters use this template for competitive analysis, market positioning, and product differentiation narratives. Suitable for business plans, investor relations presentations, proposals, and quarterly performance reports.
-
Slide Structure
Two-slide deck. Each slide contains a title area, four category axis labels, dual-series bars (teal and lime, ranging 0–4), and two circular icon callout boxes at the bottom for text input. Optimized for 16:9 widescreen display format.
Related Products
-

Competitiveness Table and Chart Analysis – Market and Competitor Analysis
#Market and Competitor Analysis #Diagram #Graph
-

Four Color Infographic Bar Chart Template – Visualize Your Competitive Advantage
#Market and Competitor Analysis #Graph #Competitor Analysis
-

Bar Chart Visualizing Freight Transport Trends – Essential Market Analysis Tool
#Market and Competitor Analysis #Graph #Text Box
-

Analyzing 2 Comparison Graphs - Slides for Deriving Competitive Advantage
#Market and Competitor Analysis #Graph #Competitor Analysis
