Carrying Rank Chart by Item – Efficient Market Analysis
RJ0800029_19
- Last Update 08/07/2025
- File Size 0.4MB
- # of Slides 2
- File Format PPTX
- Slide Ratio 16:9
- Color
Keywords
- #Content-Based Slides
- #Design-Based Slides
- #Market and Competitor Analysis
- #Diagram
- #Market Status
- #Competitive Advantage
- #Cluster
- #Table
- #Inclusive Cluster Diagram
- #16:9
- #concentric circle diagram PowerPoint
- #ranking chart slide template
- #market analysis presentation
- #competitive advantage diagram
- #item comparison PowerPoint slide
About the Product
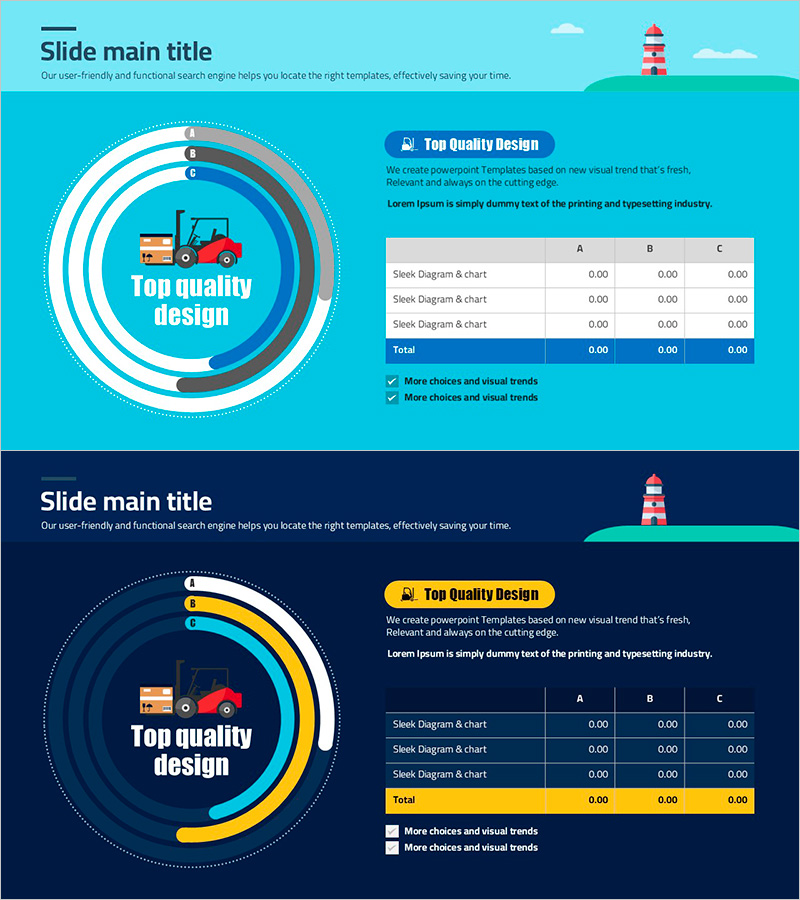
A PowerPoint slide set that visualizes item-by-item carrying rank through concentric circle structure. Featuring a bright turquoise background with white, gray, and blue concentric circles arranged in 5 levels, with a central icon emphasizing the core message. The right side includes a 3-item comparison table for competitive advantage analysis and market share comparison. This 2-slide presentation template is ready to use immediately for various business presentations and market analysis reports.
Usage Points
-
Main Usage
Express item-by-item carrying rank and market share through concentric circle structure to intuitively convey competitive advantage analysis. The central icon and 5-level circular layout emphasize the core message, while the right comparison table presents numerical data simultaneously.
-
How to Use
Use in business reports, marketing plans, and investor presentations within the market analysis section. Place competitors, products, or market segments in each concentric circle level, and input revenue, market share, growth rate, and other metrics in the table for comparative analysis presentation.
-
Recommended For
Marketing managers, executives, consultants, and sales teams use this for market situation analysis and competitive strategy development. Particularly suitable for strategic meetings and executive briefings where multi-item ranking, prioritization, and hierarchical relationships must be clearly expressed.
-
Slide Structure
Slide 1: Bright turquoise background with 5-level concentric circle diagram (white, gray, blue gradient), central icon, right 3×3 comparison table (blue header, white cells). Slide 2: Dark navy background with identical concentric circle structure (yellow and blue accent), yellow badge title, identical table (yellow header, navy cells).
Related Products
-

Running Silhouette Chart - Market and Competitor Analysis
#Market and Competitor Analysis #Diagram #Other
-

Dark AI vs VC Comparison Table Slide – Case Study PowerPoint
#Market and Competitor Analysis #Diagram #Market Status
-

Visualizing Market Status with Horizontal Bar Chart – Emphasizing Competitive Edge
#Market and Competitor Analysis #Graph #Market Status
-

Digital Device Usage Overview Slide – Market Analysis and Competitive Advantage
#Market and Competitor Analysis #Graph #Other
