Camping Business Target Market Donut Chart – Key to Market Analysis
RJ0600031_23
- Last Update 06/29/2025
- File Size 1.5MB
- # of Slides 2
- File Format PPTX
- Slide Ratio 16:9
- Color
Keywords
About the Product
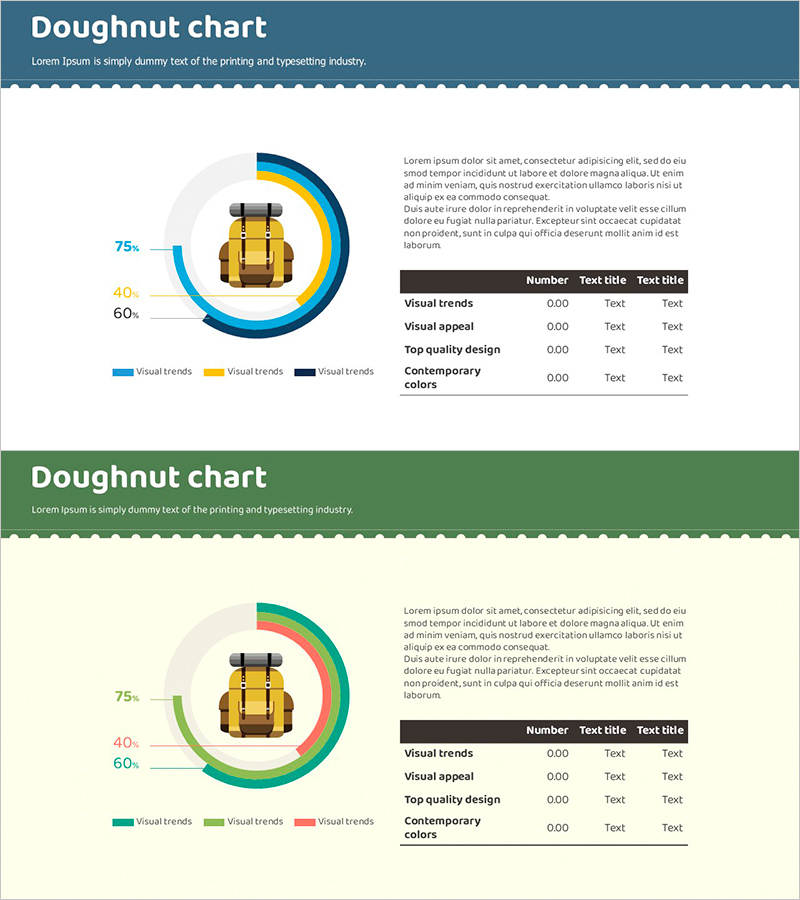
A donut chart PowerPoint slide that visualizes the target market for camping business across three data segments. The circular graph uses three distinct colors—blue, yellow, and black—to represent market share, customer demographics, and business division composition at a glance. The left side displays percentage values (75%, 60%, 40%) for quantitative clarity, while the right side features descriptive text and an information table for detailed analysis. This 2-slide set provides alternative color schemes (blue/yellow/black and green/orange/red) to match your presentation theme and brand guidelines. The donut format allows you to place icons or key metrics in the center space for enhanced visual hierarchy.
Usage Points
-
Main Usage
Visualize target market composition, customer segment ratios, and business division market share for camping enterprises using a donut chart format. The hollow center enables placement of icons or core metrics, facilitating clear information layering and visual emphasis.
-
How to Use
Apply this slide in the market analysis section of business plans, marketing proposals, or investor pitch decks. Input actual data into the left donut chart and write segment descriptions and strategies in the right text area. Modify color combinations to compare multiple market scenarios or business models.
-
Recommended For
Camping and leisure industry planners, marketing managers, business analysts, and consultants presenting market segmentation findings. Ideal for investor presentations, executive briefings, and strategic planning meetings requiring data-driven decision support.
-
Slide Structure
Slide 1: Three-segment donut chart in blue/yellow/black with left-aligned percentage labels (75%, 60%, 40%) and right-side text block plus 4-row information table. Slide 2: Identical layout with green/orange/red color scheme. 16:9 widescreen format optimized for monitor and projector display.
Related Products
-

Key Competitive Factors in Market Analysis – First Step Toward Competitive Advantage
#Market and Competitor Analysis #Diagram #Graph
-

Type Comparison Analysis Graph & Table – Effective Tool for Market Analysis
#Market and Competitor Analysis #Diagram #Graph
-

Drug Addiction Risk Analysis Graph Chart – Insightful Information Delivery
#Market and Competitor Analysis #Diagram #Graph
-

Shareholder Status Analysis Donut Pie Chart – Corporate Growth and Competitive Analysis
#Company Introduction #Market and Competitor Analysis #Diagram
