Touch Wide Slide Template – Column Chart & Table
RJ0200008_27
- Last Update 03/30/2025
- File Size 3.3MB
- # of Slides 2
- File Format PPTX
- Slide Ratio 16:9
- Color
Keywords
- #Content-Based Slides
- #Design-Based Slides
- #Market and Competitor Analysis
- #Diagram
- #Graph
- #Market Status
- #Market Analysis
- #Table
- #Column
- #Standard Table
- #Grouped Column
- #16:9
- #column chart PowerPoint
- #bar graph slide template
- #data comparison presentation
- #market analysis PPT
- #table and chart slide design
About the Product
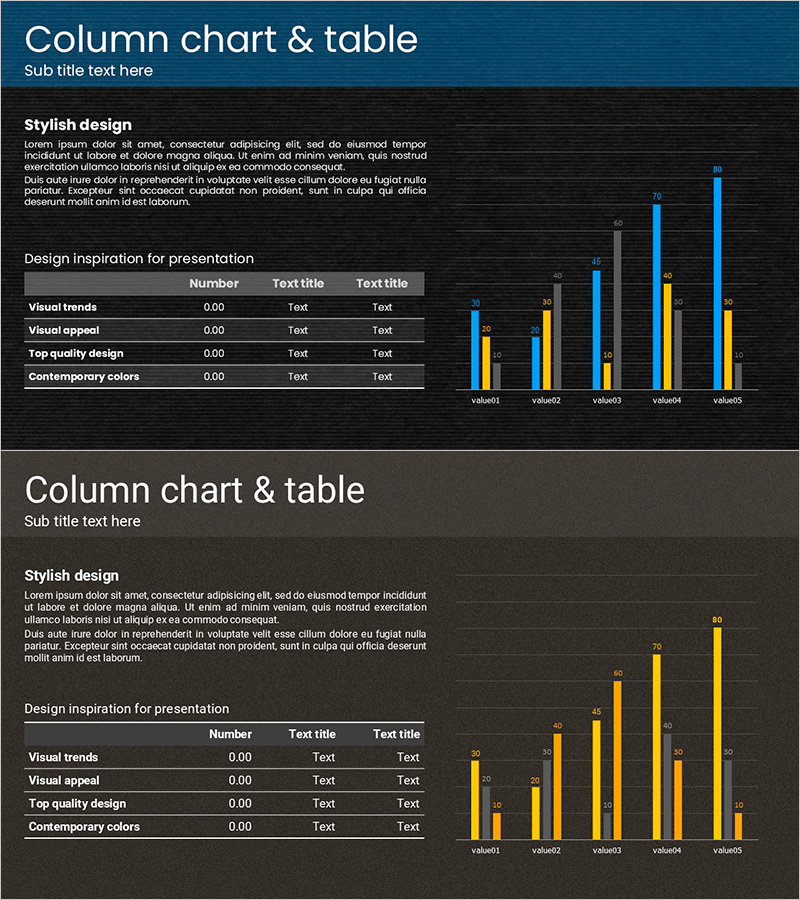
A professional column chart and data table PowerPoint slide template designed for market analysis and comparative data visualization. Features a dark background with blue and yellow dual-series bar charts displaying 5 data points, paired with an editable data table on the left side. The 16:9 widescreen format includes 2 slides ready for business reports, marketing presentations, sales analysis, and financial summaries. Both chart and table elements are fully editable, allowing you to input your own data and customize values instantly for presentations, quarterly reports, and strategic planning documents.
Usage Points
-
Main Usage
Visualizes numerical data comparisons and trend analysis across multiple categories. The column chart enables quick visual comparison of 5 items, while the data table provides precise numerical values. Ideal for market size analysis, sales performance, KPI tracking, and any scenario requiring side-by-side data comparison.
-
How to Use
Enter item names and values into the left data table, and the right column chart automatically updates. Use blue and yellow series to distinguish between two data groups simultaneously. The high-contrast dark background ensures clarity during projector presentations and digital displays.
-
Recommended For
Executive reports, quarterly business reviews, marketing performance analysis, competitive benchmarking, market research presentations, financial statements, and sales dashboards. Particularly valuable for consulting, finance, marketing, and sales teams presenting data-driven insights.
-
Slide Structure
2-slide set. Each slide contains a title area at top, a 4-row × 3-column editable data table on the left (item names and numeric values), and a 5-item dual-series column chart on the right. Unified dark background with white text and blue-yellow accent colors throughout.
Related Products
-

Marketing Performance Analysis Chart by Year – Visualizing Market Trends
#Market and Competitor Analysis #Diagram #Graph
-

Industrial Data Report for Market Analysis Slides
#Market and Competitor Analysis #Diagram #Graph
-

Table Chart & Clustered Column Graph – Market and Competitor Analysis
#Market and Competitor Analysis #Diagram #Graph
-

Business Status Chart – Presentation Template for Market Analysis
#Market and Competitor Analysis #Diagram #Graph
