Orange Export Trends Visualization Template – Market Growth
RJ0800007_11
- Last Update 08/01/2025
- File Size 3.2MB
- # of Slides 2
- File Format PPTX
- Slide Ratio 16:9
- Color
Keywords
- #Content-Based Slides
- #Design-Based Slides
- #Market and Competitor Analysis
- #Graph
- #Industry Trends
- #Competitive Advantage
- #Column
- #Segmented Column
- #16:9
- #stacked column chart PowerPoint
- #bar graph presentation template
- #year-over-year comparison slide
- #data visualization PPT
- #how to create stacked chart in PowerPoint
- #market analysis presentation
About the Product
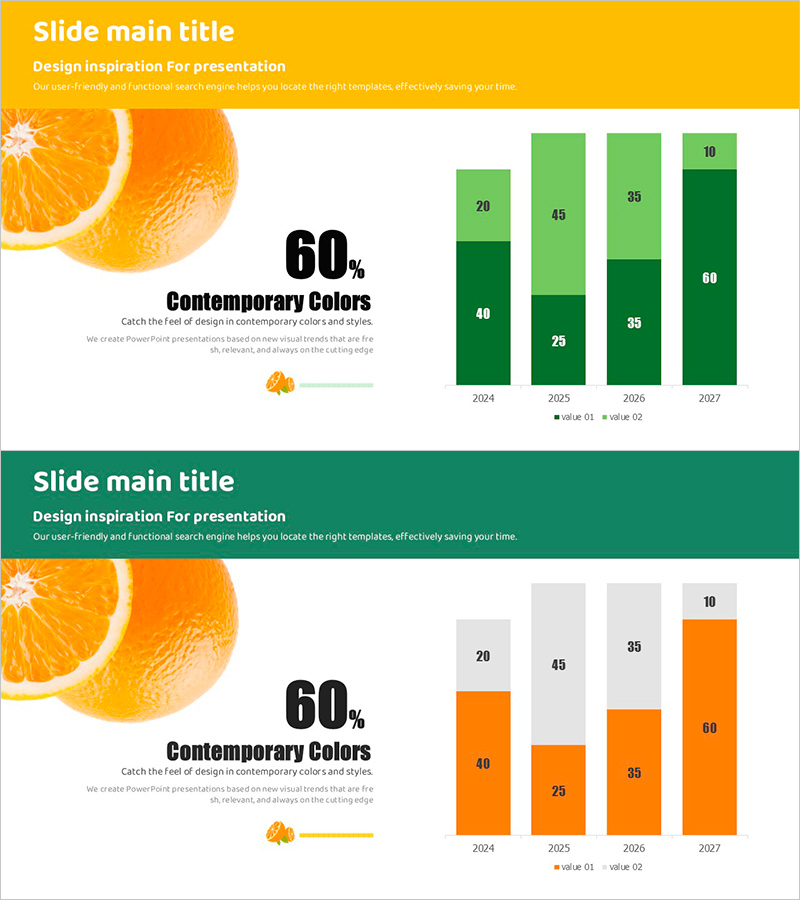
A stacked column chart PowerPoint slide that clearly visualizes year-over-year data changes from 2024 to 2027. This presentation template displays two data series (value 01 and value 02) with distinct color coding, making it ideal for market trends, sales performance, export-import statistics, and comparative analysis. The slide deck includes two color schemes—yellow header and green header—each featuring an orange fruit illustration and dedicated text areas for key messaging. Created in 16:9 widescreen format for seamless compatibility with modern projectors and displays, this fully editable PPTX file enables quick customization for your specific data and branding needs.
Usage Points
-
Main Usage
Use this slide to compare multi-year data trends with two or more data series simultaneously. The stacked column structure displays both total values and individual component proportions, making it perfect for market share analysis, revenue composition, export-import statistics, budget allocation, and complex data visualization scenarios.
-
How to Use
Double-click the chart bars, color blocks, and numerical labels to replace them with your actual data. Edit the header text and description areas to match your presentation topic, and adjust the color scheme to align with your corporate branding if needed. The 16:9 format is optimized for widescreen display presentations.
-
Recommended For
Ideal for executive reports, quarterly earnings presentations, market analysis seminars, investor relations meetings, and academic presentations where quantitative data must be communicated persuasively. Highly recommended for finance teams, marketing departments, sales divisions, R&D teams, and any group requiring data-driven decision-making presentations.
-
Slide Structure
Two-slide deck with identical stacked column chart layouts. Each slide displays a 4-year timeline (2024–2027) with two data series (value 01 and value 02) represented by color-coded column segments. The layout includes a colored header section (yellow or green), an orange fruit illustration on the left, the chart area on the right, numerical labels, and a legend for data series identification.
Related Products
-

3D Segmented Bar Graph for Performance Analysis – Market Trends
#Market and Competitor Analysis #Graph #Customer Analysis
-

Sophisticated Vertical Bar Chart – Market Trend Analysis
#Market and Competitor Analysis #Graph #Industry Trends
-

Comparison Chart of Pet Expenditure – Essential Template for Competitor Analysis
#Market and Competitor Analysis #Diagram #Graph
-

Analysis of 3D Printing Progress – Market Trends and Insights
#Market and Competitor Analysis #Graph #Market Analysis
