Rising Graph for Target Sales Visualization – Business Success Strategy
RJ0800027_6
- Last Update 08/07/2025
- File Size 0.1MB
- # of Slides 2
- File Format PPTX
- Slide Ratio 16:9
- Color
Keywords
About the Product
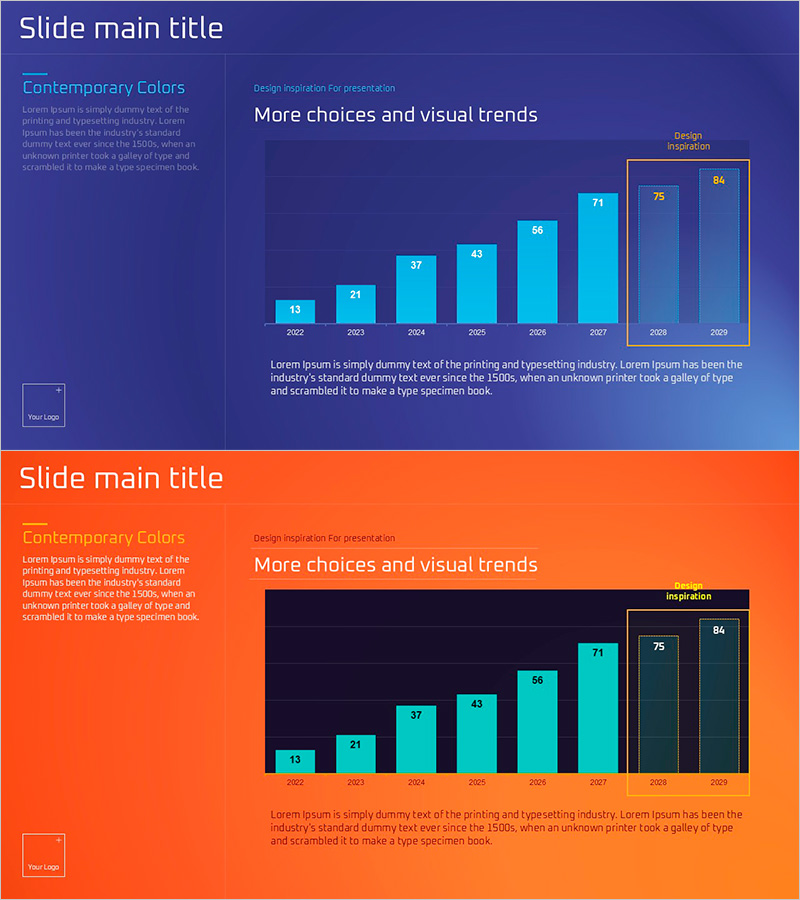
This free PowerPoint slide features a dark navy background with cyan vertical bars and an orange highlight box to visually separate target or forecast periods. The layout displays eight years of data (2022–2029) in a clear two-column structure: a text panel on the left for titles and context, and a bar chart with a caption area on the right. The orange border box draws immediate attention to the 2028–2029 target range, making it easy for audiences to distinguish actual results from projections. Two color themes are included—dark navy and orange-red—so you can match the slide to your presentation's visual identity. Simply replace the year labels, numeric values, and text fields to adapt this slide for financial plans, business proposals, investor pitch decks, or performance reports. For more graph and chart slides in similar styles, explore the full collection at GoodPello.
Usage Points
-
Main Usage
Visualizes year-over-year sales trends or target figures using a vertical bar chart, with an orange highlight box to clearly distinguish the target or forecast period from actual results.
-
How to Use
Enter your slide title and context text in the left panel, replace the year labels and numeric values in the bar chart with your actual data, and adjust the orange highlight box to cover your target period.
-
Recommended For
Financial planners, startup founders, business analysts, and anyone preparing investor pitch decks, business plans, financial reports, or annual performance presentations.
-
Slide Structure
Single-slide layout with 8 vertical bars (2022–2029), an orange highlight box over the target range (2028–2029), a 2-item left text panel, and a bottom caption area. Includes both dark navy and orange-red color themes.
Related Products
-

Data Visualization with Bar Charts – Presentation for Efficient Choices
#Free Graphs
-

Competitive Advantage Analysis Bar Chart – Data Visualization
#Free Graphs
-

Vertical Bar Chart for Data Analysis – Business Insights
#Free Graphs
-

Tree Yellow Purple Area Chart – Innovation in Data Visualization
#Free Graphs
