Table Highlights – Effective Data Delivery
RJ0800027_21
- Last Update 08/07/2025
- File Size 0.1MB
- # of Slides 2
- File Format PPTX
- Slide Ratio 16:9
- Color
Keywords
About the Product
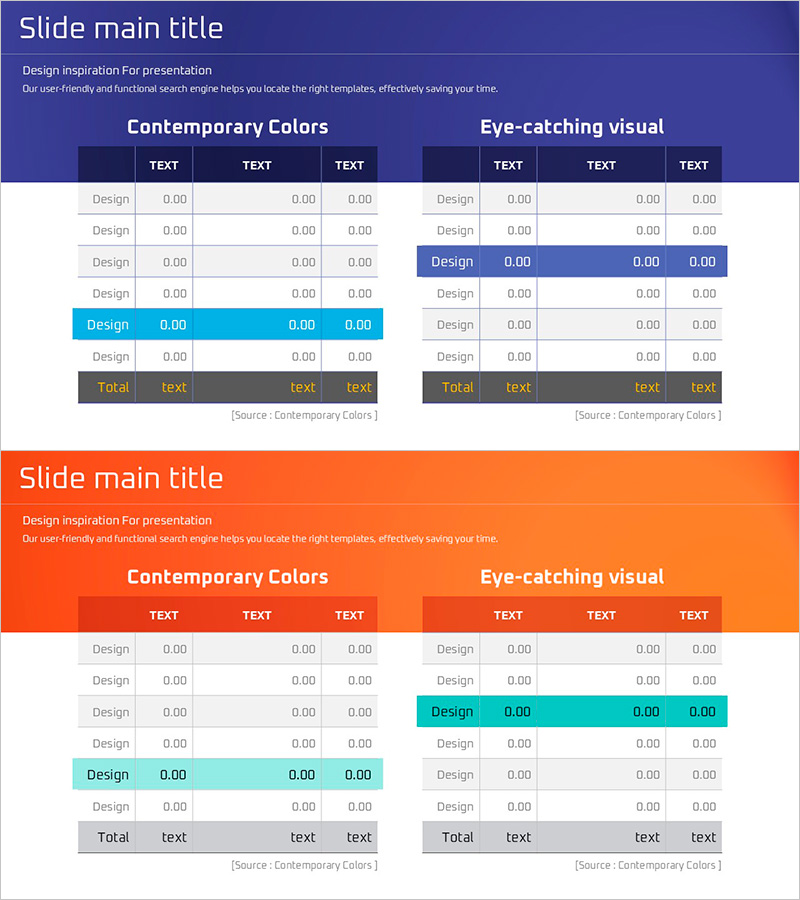
An essential table diagram PowerPoint slide for data-driven presentations. This 2-slide set uses a dark blue background with bright accent colors (cyan and orange) to make key data stand out visually. Each slide features a 6-column table structure with highlighted rows in contrasting colors to draw audience attention to critical information. Optimized for modern 16:9 widescreen presentations and delivered in fully editable PPTX format. Perfect for market analysis, financial reports, performance comparisons, and any presentation requiring structured numerical data visualization.
Usage Points
-
Main Usage
Organize multiple data points in rows and columns while using color highlighting to emphasize specific values, making comparative analysis immediately clear. Effectively conveys market analysis, competitive benchmarking, financial performance, and departmental metrics in a structured format that enhances audience comprehension.
-
How to Use
Enter your data into the table cells and modify the background color of rows or cells you want to emphasize. Maintain the dark blue header and gray/cyan/orange highlight scheme while editing text and numbers. Adjust the number of rows or columns as needed for your presentation context.
-
Recommended For
Finance teams presenting quarterly results, marketing teams sharing market research findings, sales teams analyzing competitors, executives reviewing business performance, consulting firms preparing client proposals, and academic presenters comparing research data.
-
Slide Structure
Slide 1: Dark blue background + 6-column table + 5 data rows + cyan highlight on 1 row. Slide 2: Dark blue background + 6-column table + 5 data rows + orange highlight on 1 row. Source attribution area at bottom of each slide. 16:9 widescreen format, fully editable PPTX.
Related Products
-

Car Wide Template Diagram2 – Business Area Visualization
#Business Introduction #Diagram #Business Areas
-

Market Analysis Slide Using Donut Charts and Table
#Market and Competitor Analysis #Diagram #Graph
-

Fantastic Wide PPT Sequence Diagram – Business Strategy Direction
#Business Strategy #Diagram #Business Direction
-

Schedule Template with Color Theme – Business Management and Action Plans
#Business Management #Diagram #Implementation Plan
