Component Development Status and Share – Effective Data Visualization
RJ0800027_16
- Last Update 08/07/2025
- File Size 3.9MB
- # of Slides 2
- File Format PPTX
- Slide Ratio 16:9
- Color
Keywords
- #Content-Based Slides
- #Design-Based Slides
- #Product/Service Introduction
- #Market and Competitor Analysis
- #Graph
- #Development Status
- #Market Share
- #Circles
- #Doughnut Chart
- #16:9
- #donut chart PowerPoint
- #pie chart slide template
- #market share visualization
- #data visualization PPT
- #3-segment donut chart
- #ratio presentation slide
About the Product
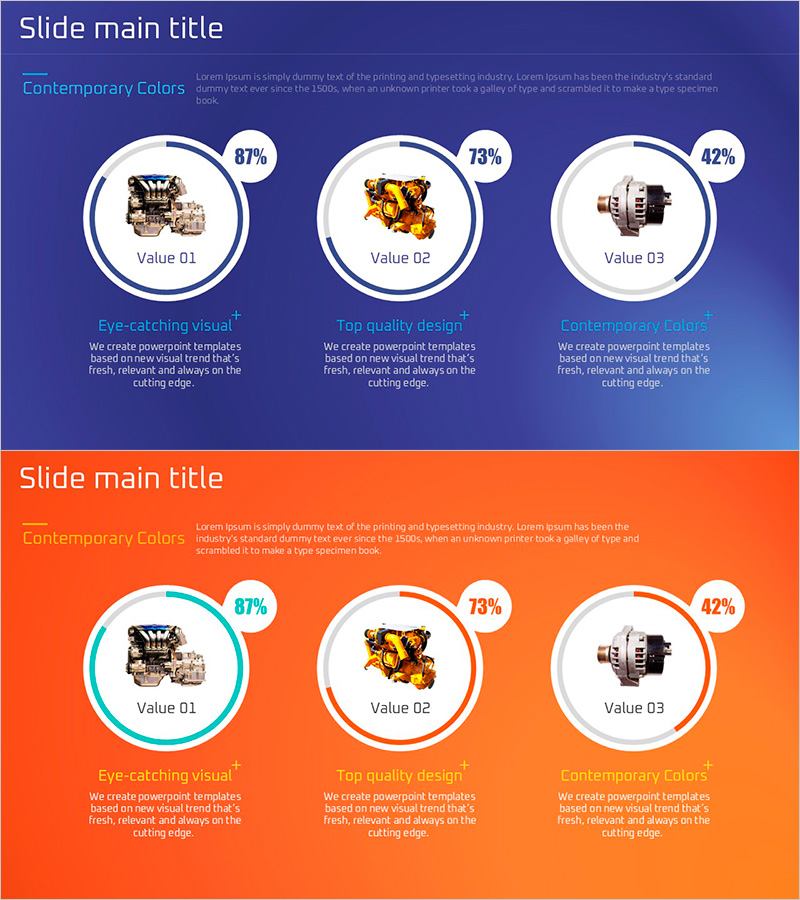
A professional donut chart PowerPoint slide designed to effectively present component development status and market share data. Three donut-shaped pie charts are arranged horizontally on a dark blue background, with percentage values clearly displayed for each segment. The center of each circular chart provides space for product images or icons, allowing simultaneous presentation of statistical data and visual information. The 2-slide set includes two color variations: dark blue and orange backgrounds, optimized for 16:9 widescreen format. This premium PPT resource is ready to use in business reports, marketing analysis presentations, and market research briefings.
Usage Points
-
Main Usage
Visualizes proportional relationships such as market share, product composition ratios, and sales distribution. The donut chart center accommodates product images or key metrics, enabling simultaneous communication of data and visual information to audiences.
-
How to Use
Apply in business report market analysis sections, marketing plan competitive comparison pages, investment pitch deck market size explanations, and quarterly performance reports showing revenue composition. Customize the percentage values and colors in each donut chart to match your specific data.
-
Recommended For
Marketing managers, business planning teams, financial analysts, sales directors, and executives presenting market data and sales performance. Particularly effective for comparative analysis of multiple product lines or regional market share in presentations.
-
Slide Structure
2-slide set featuring one dark blue background slide and one orange background slide. Each slide displays 3 donut-shaped pie charts arranged horizontally with center image areas labeled Value 01–03 and percentage values (87%, 73%, 42%). Description text areas below each chart allow for additional information input and customization.
Related Products
-

Analysis of Work Progress – Utilizing Pie Chart
#Product/Service Introduction #Market and Competitor Analysis #Graph
-

Development Status Analysis Donut Chart – Market Share Visualization
#Product/Service Introduction #Market and Competitor Analysis #Graph
-

Website Technology Development Status Graph – Market Share and Trends
#Product/Service Introduction #Market and Competitor Analysis #Graph
-

Map Donut Graph for Visualizing Market Share – Symbol of Practicality and Change
#Product/Service Introduction #Market and Competitor Analysis #Graph
