Music Competition Donut Chart – Market Share Analysis
RJ0500020_29
- Last Update 06/12/2025
- File Size 0.6MB
- # of Slides 2
- File Format PPTX
- Slide Ratio 16:9
- Color
Keywords
About the Product
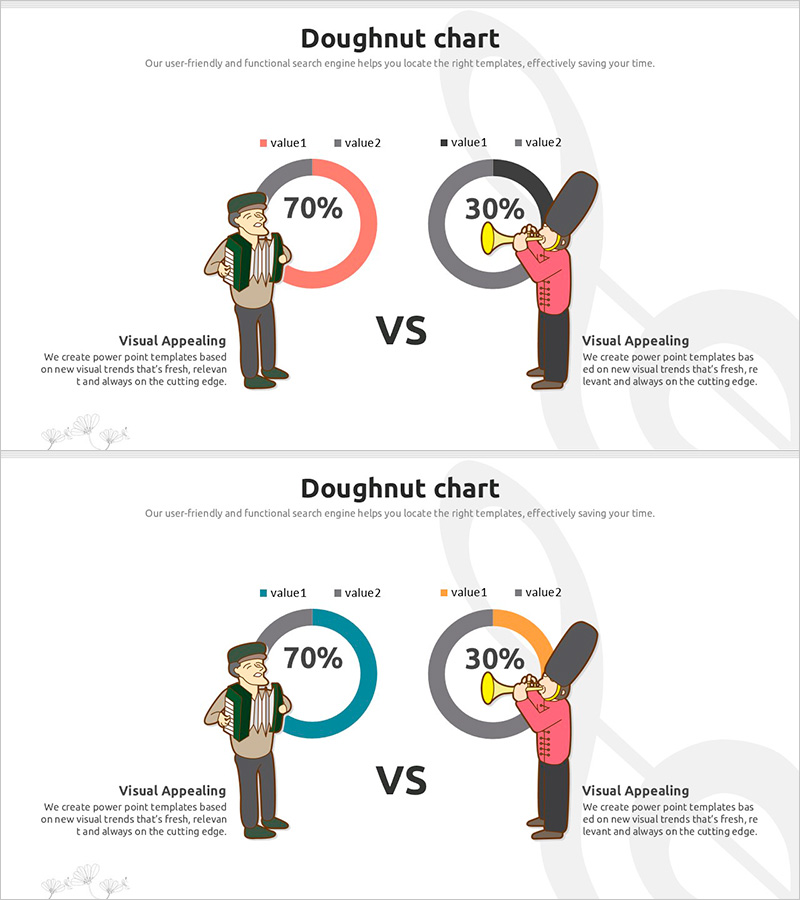
A donut chart PowerPoint slide designed for music competition market analysis and competitive positioning. Two donut graphs display 70% and 30% ratios on the left and right sides, using a vibrant color palette of pink, black, gray, and teal to create visual contrast. Illustrated characters positioned beside each chart intuitively convey competitive dynamics, while a 'VS' label clarifies the comparison structure. This presentation slide is ready for immediate use in market share analysis, competitive advantage assessment, and sales ratio visualization across various business contexts.
Usage Points
-
Main Usage
Visualizes and compares two data sets using donut graphs, ideal for presenting market share, sales ratios, and competitive advantages. Helps audiences quickly grasp market dynamics in industries where competition is critical, such as music, entertainment, media, and sports.
-
How to Use
Replace the donut chart values with your own data for immediate deployment. Update the legend labels (value1, value2) to match your categories, and leverage the character illustrations and 'VS' text to emphasize competitive scenarios. Use in business reports, marketing plans, investor presentations, and competitive analysis sections.
-
Recommended For
Marketing managers, business strategists, sales executives, consultants, and investor relations professionals presenting competitive analysis, market positioning, and sales performance. Ideal for industries with intense competition such as music, entertainment, consumer goods, finance, and telecommunications.
-
Slide Structure
Two-slide layout. Slide 1: Two donut charts (70%, 30%) in pink and black, character illustrations, 'VS' label, and legend. Slide 2: Two donut charts in teal and gray with identical layout. 16:9 widescreen format, PPTX file with fully editable colors, values, and text.
Related Products
-

Circle Donut Market Share Graph – Visual Elements for Market Analysis
#Market and Competitor Analysis #Graph #Market Share
-

Fashion Design Comparative Donut Chart – Market Share Analysis
#Market and Competitor Analysis #Graph #Market Share
-

Market Share and Competitive Advantage via Bar and Donut Charts – Product Satisfaction Survey
#Market and Competitor Analysis #Graph #Market Share
-

Green Red Donut Chart – Market Share Analysis
#Market and Competitor Analysis #Graph #Market Share
