Money Donut Chart for Market Share Analysis – Emphasizing Competitive Advantage
RJ0800016_6
- Last Update 08/04/2025
- File Size 0.3MB
- # of Slides 2
- File Format PPTX
- Slide Ratio 16:9
- Color
Keywords
- #Content-Based Slides
- #Design-Based Slides
- #Market and Competitor Analysis
- #Diagram
- #Graph
- #Market Share
- #Competitive Advantage
- #Cluster
- #Circles
- #Inclusive Cluster Diagram
- #Doughnut Chart
- #16:9
- #donut chart PowerPoint
- #pie chart slide template
- #market share analysis
- #multi-layer data visualization
- #business analytics presentation
About the Product
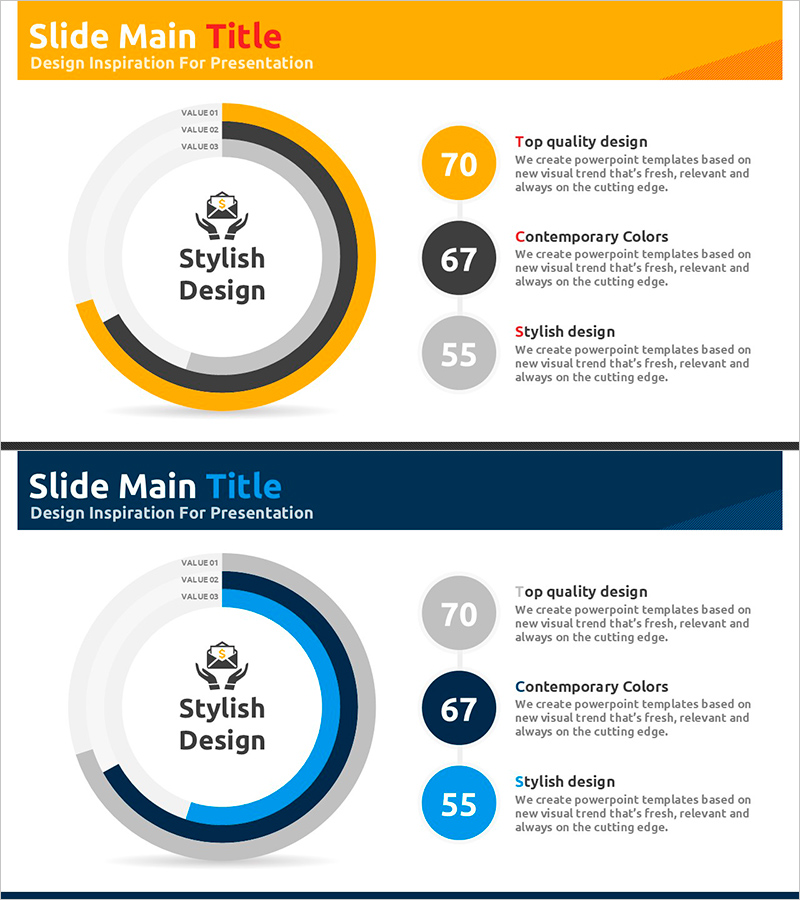
A professional donut chart PowerPoint slide for visualizing market share and competitive advantage through concentric ring data representation. The three-layer structure uses gold and gray tones to clearly express hierarchical information, with a central icon and right-aligned numeric circles emphasizing data hierarchy. This 2-slide presentation template is ready to use for business analysis, financial reports, strategy presentations, and competitive positioning discussions. Delivered in 16:9 widescreen PPTX format, fully editable across all PowerPoint versions.
Usage Points
-
Main Usage
Visualize multi-layered data such as market share, budget allocation, and competitor comparison using concentric ring structure to simultaneously convey hierarchical relationships and proportions. Central icon highlights the core topic while right-aligned numeric circles display quantitative information for each layer.
-
How to Use
Apply in business analysis presentations, financial reports, strategy meetings, investor pitch decks, and competitive reviews. Customize each layer's color and values to match your actual data and presentation context.
-
Recommended For
Executives, financial analysts, marketing strategists, management consultants, and business development teams requiring data-driven decision-making. Particularly effective for competitive analysis, market research, and resource allocation discussions.
-
Slide Structure
2-slide set. Slide 1: Gold header background + 3-layer donut chart with VALUE 01-03 labels + central icon + three numeric circles on right (70, 67, 55). Slide 2: Navy header background + identical structure with blue-tone donut chart. 16:9 widescreen PPTX format.
Related Products
-

Fashion Design Comparative Donut Chart – Market Share Analysis
#Market and Competitor Analysis #Graph #Market Share
-

Animals Nature Donut Chart Infographics – Market Share Analysis
#Market and Competitor Analysis #Graph #Market Share
-

Speed Timer Diagram for Market Share Analysis
#Market and Competitor Analysis #Diagram #Graph
-

Ranking of Vegetables that Children Dislike – Fun and Engaging
#Product/Service Introduction #Market and Competitor Analysis #Diagram
