Basic Three-Color Donut Chart - Convey Data Clearly
RJ0800026_6
- Last Update 09/08/2025
- File Size 0.4MB
- # of Slides 2
- File Format PPTX
- Slide Ratio 16:9
- Color
Keywords
About the Product
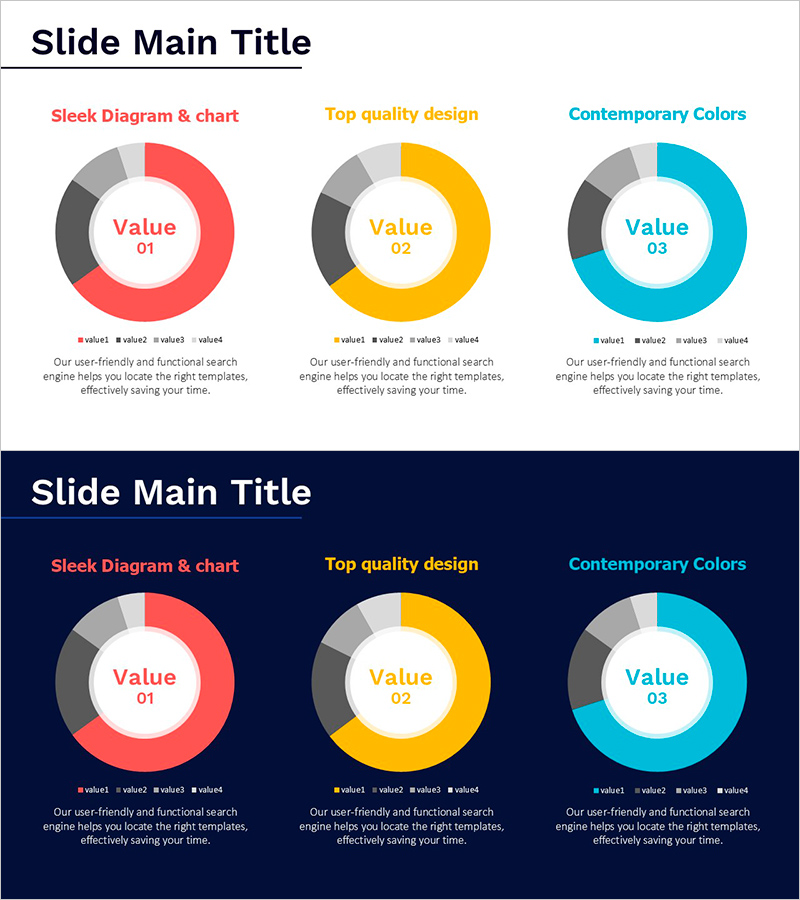
This free PowerPoint slide features three donut charts arranged side by side in a clean three-column layout, each using a combination of red, yellow, or cyan as the primary accent color alongside dark gray and light gray segments. Both a light version with a white background and a dark version with a navy background are included in a single PPTX file, allowing you to choose the look that best fits your presentation style. Each donut chart includes a central value text area to highlight key figures, along with a legend and description text block below for added context. This slide is ideal for comparing three sets of ratio data—such as market share, financial breakdowns, survey results, or KPI status—in a single, easy-to-read presentation slide. Simply update the chart proportions and text to match your data, and the slide is ready to insert into any deck. For a wider collection of graph and chart slides, explore the full library at GoodPello.
Usage Points
-
Main Usage
Designed to visually compare three sets of ratio or proportion data—such as market share, financial ratios, survey results, or KPI metrics—using three side-by-side donut charts that audiences can read at a glance.
-
How to Use
Select either the light (white background) or dark (navy background) version to match your presentation tone, then replace the chart segment proportions, central value text, legend labels, and description copy with your actual data.
-
Recommended For
Suitable for marketers, business analysts, financial planners, and consultants who need to present ratio data visually, as well as professionals adding chart slides to business proposals, IR decks, or performance reports.
-
Slide Structure
Single-slide layout with three donut charts arranged in an equal three-column grid. Each chart includes four color segments, a central value text area, a bottom legend row, and a description text block. Two color themes included: light (white) and dark (navy).
Related Products
-

Market Analysis by Year Horizontal Bar Graph
#Free Graphs
-

Tree Yellow Purple Area Chart – Innovation in Data Visualization
#Free Graphs
-

Business Comparison Analysis Graph – Strengthening Market and Competitor Analysis
#Free Graphs
-

Competitive Advantage Bar General Graph – Emphasizing Performance through Market Analysis
#Free Graphs
