Competitive Advantage Analysis Bar Chart – Data Visualization
RJ0400052_21
- Last Update 05/31/2025
- File Size 6.7MB
- # of Slides 2
- File Format PPTX
- Slide Ratio 16:9
- Color
Keywords
About the Product
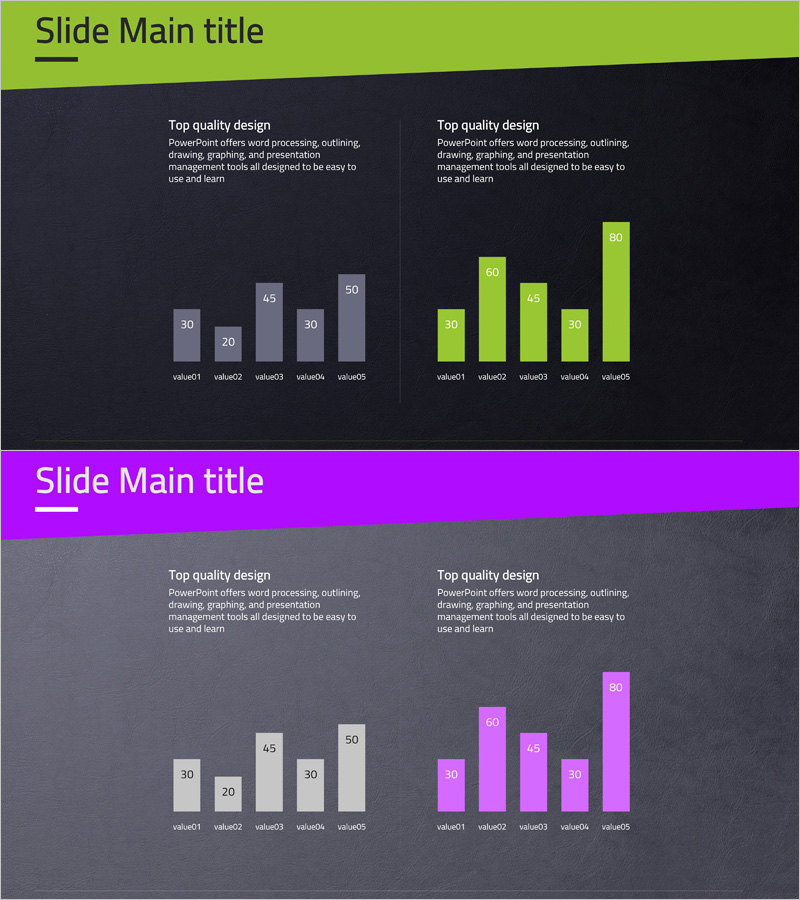
This free PowerPoint slide features a dual-column vertical bar chart layout on a dark black background, available in two accent color versions: lime green and purple. The two-column structure places two data sets side by side, making it easy to highlight numerical differences between competitors at a glance. Each chart section includes a subtitle and description text area, allowing presenters to add context alongside the data. Value labels on each bar are fully editable. This presentation slide fits seamlessly into competitive analysis reports, business plans, and marketing strategy decks wherever a side-by-side comparison is needed. Simply replace the numbers and text to match your data, and the slide is ready to use. Explore more graph and chart slides at GoodPello.
Usage Points
-
Main Usage
Designed to visually compare two sets of numerical data side by side using vertical bar charts, making competitive advantages and performance gaps immediately clear to the audience.
-
How to Use
Choose the lime green or purple accent version to match your brand, then replace the bar value labels and subtitle text with your actual data. The slide is ready to insert into any presentation.
-
Recommended For
Ideal for business analysts, strategy consultants, marketers, and sales professionals who need a clean, data-driven comparison slide for competitive analysis or performance reporting.
-
Slide Structure
Single-slide layout with one title banner at the top, two vertical bar chart sections side by side (5 bars each), two subtitle and description text areas, and 10 editable value labels.
Related Products
-

Business Comparison Analysis Graph – Strengthening Market and Competitor Analysis
#Free Graphs
-

Comparative Analysis Bar Graph – Market and Competitor Analysis
#Free Graphs
-

Vertical Bar Chart for Data Analysis – Business Insights
#Free Graphs
-

Competitor Analysis and Market Trend Graph – Blue, Orange, Green Colors
#Free Graphs
