Blue Purple Bundled Chart – Optimized for Market Analysis
RJ0600107_8
- Last Update 07/20/2025
- File Size 1.3MB
- # of Slides 2
- File Format PPTX
- Slide Ratio 16:9
- Color
Keywords
About the Product
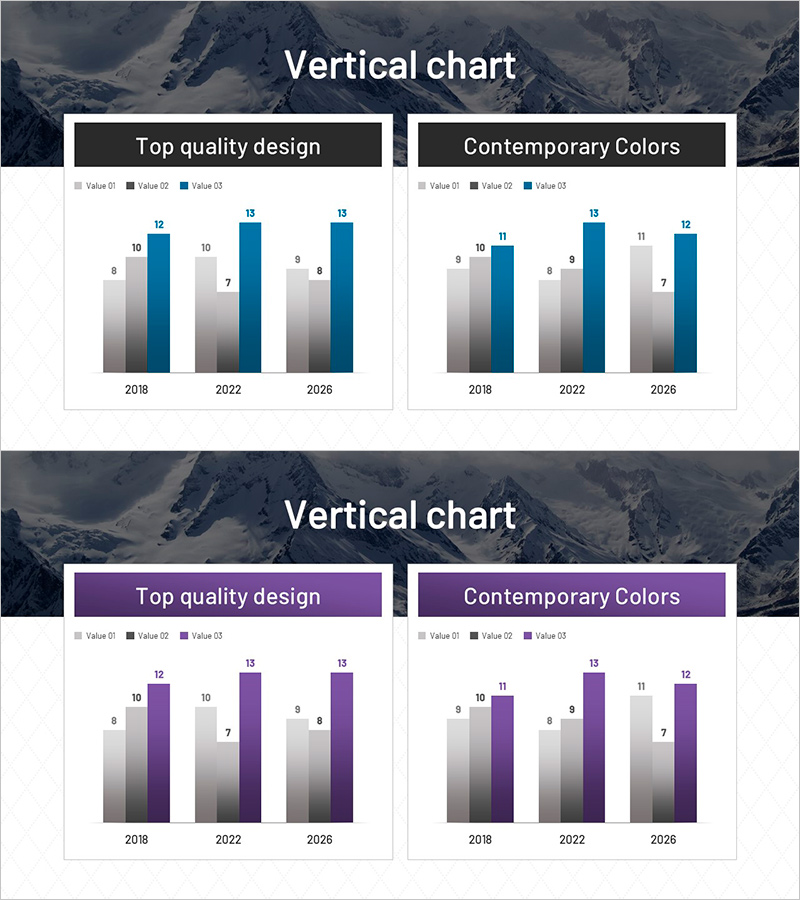
A vertical clustered bar chart PowerPoint slide comparing market data across three series from 2018 to 2026. Featuring blue and purple gradient bars with clear numerical labels above each bar, this presentation template offers two design variations: 'Top Quality Design' and 'Contemporary Colors.' Ideal for market analysis, sales performance reports, growth rate comparisons, and business presentations. The 16:9 widescreen PPTX format allows easy customization and data editing for professional data visualization.
Usage Points
-
Main Usage
Visualizes year-over-year and multi-metric comparisons with three data series displayed side-by-side. The clustered arrangement enables simultaneous comparison of multiple indicators at the same time point, while clear numerical labels ensure accurate data communication and professional presentation impact.
-
How to Use
Insert into market analysis reports, sales performance presentations, and executive briefing decks. Double-click to edit existing values or modify colors to match corporate branding. Choose between two design versions (Top Quality Design or Contemporary Colors) based on presentation context and audience preference.
-
Recommended For
Recommended for executives, marketing teams, sales departments, finance teams, consultants, and data analysts. Particularly effective for quarterly performance comparisons, competitive benchmarking, market size trend analysis, and strategic planning presentations.
-
Slide Structure
2-slide set. Each slide features a vertical clustered bar chart with 3 data series (Value 01, Value 02, Value 03) across 3 time periods (2018, 2022, 2026). Numerical labels appear above each bar, with editable header area for chart titles and legends.
Related Products
-

Carbon Neutral Sales and Profit Chart – Sustainable Management
#Market and Competitor Analysis #Financial Plans and Performance #Graph
-

Blue Orange Growing Bar Graph – Performance and Competitive Edge
#Business Strategy #Market and Competitor Analysis #Graph
-

Triangular Pattern Column Chart Template – Market Competitive Advantage Analysis
#Market and Competitor Analysis #Graph #Competitor Analysis
-

Construction Equipment Usage Graph
#Market and Competitor Analysis #Graph #Competitive Advantage
