Tricolor Default Segmentation Bar Graph – Representing Market Trends
RJ0800026_14
- Last Update 08/06/2025
- File Size 0.3MB
- # of Slides 2
- File Format PPTX
- Slide Ratio 16:9
- Color
Keywords
- #Content-Based Slides
- #Design-Based Slides
- #Market and Competitor Analysis
- #Graph
- #Industry Trends
- #Horizontal Bar
- #Segmented Horizontal Bar
- #16:9
- #segmented bar chart PowerPoint
- #horizontal bar graph template
- #3-color chart slide
- #market trend visualization
- #year-over-year comparison
- #chart PowerPoint slide design
About the Product
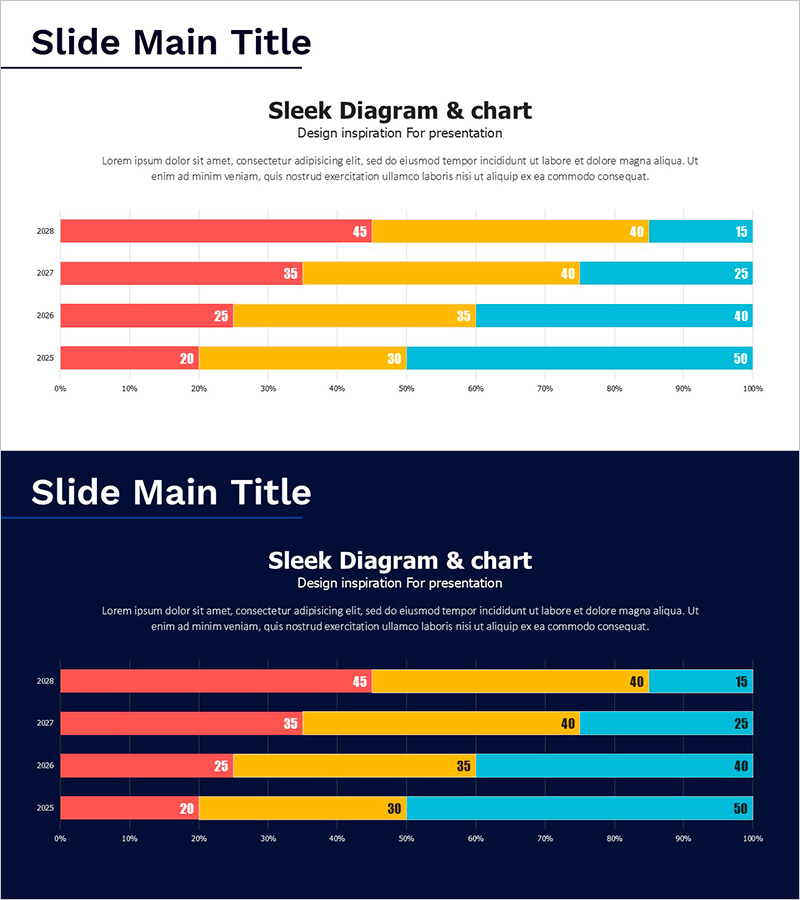
A segmented horizontal bar chart PowerPoint slide that displays year-over-year data across three distinct series. Using red, yellow, and cyan colors, this template clearly differentiates each data category while comparing trends from 2025 through 2028. Numeric labels appear on each bar segment, enabling precise data communication, and the 0–100% scale accommodates both absolute and percentage-based metrics. This slide design is ideal for presentations, reports, and business proposals that require multi-year performance analysis, market share comparisons, departmental results, or competitive positioning. The layout ensures data clarity without visual clutter.
Usage Points
-
Main Usage
The primary purpose is to compare multi-year or multi-category data across three distinct series in a single, easy-to-read format. It effectively visualizes market trends, sales performance, KPIs, departmental metrics, and competitive analysis while maintaining data accuracy through numeric labels.
-
How to Use
Insert this slide into the performance analysis or market overview section of your presentation. Simply replace the sample data with your own figures and adjust year labels, category names, and series titles as needed. The template is immediately editable and ready for live presentations or printed reports.
-
Recommended For
Marketing, sales, and business development professionals presenting market analysis; finance and executive teams reporting business performance; consultants delivering trend analysis to clients; and academics or industry analysts presenting research findings. Suitable for quarterly reviews, annual reports, investor presentations, and competitive benchmarking.
-
Slide Structure
Two-slide template featuring a 4-year horizontal bar chart (2025–2028 on Y-axis) with three color-coded segments per year. The X-axis displays a 0–100% scale with gridlines for easy reference. Numeric labels are positioned at the end of each segment, and the overall layout uses a clean, professional design with ample white space for readability.
Related Products
-

Work and Home Life Graph – Market Trends and Design Sensibility
#Market and Competitor Analysis #Graph #Industry Trends
-

Bar Chart for Eco-friendly Practices Trends Visualization
#Market and Competitor Analysis #Graph #Industry Trends
-

Visualizing Camping Business Market Share with Bar Chart
#Market and Competitor Analysis #Graph #Industry Trends
-

Animal Natural Environment Improvement Rate Future Outlook Horizontal Bar Chart
#Market and Competitor Analysis #Graph #Industry Trends
