Visualizing Camping Business Market Share with Bar Chart
RJ0600032_29
- Last Update 06/29/2025
- File Size 0.8MB
- # of Slides 2
- File Format PPTX
- Slide Ratio 16:9
- Color
Keywords
- #Content-Based Slides
- #Design-Based Slides
- #Market and Competitor Analysis
- #Graph
- #Industry Trends
- #Horizontal Bar
- #Segmented Horizontal Bar
- #16:9
- #100% stacked bar chart PowerPoint
- #market share comparison slide
- #horizontal stacked chart template
- #competitive analysis PowerPoint
- #data visualization slide download
About the Product
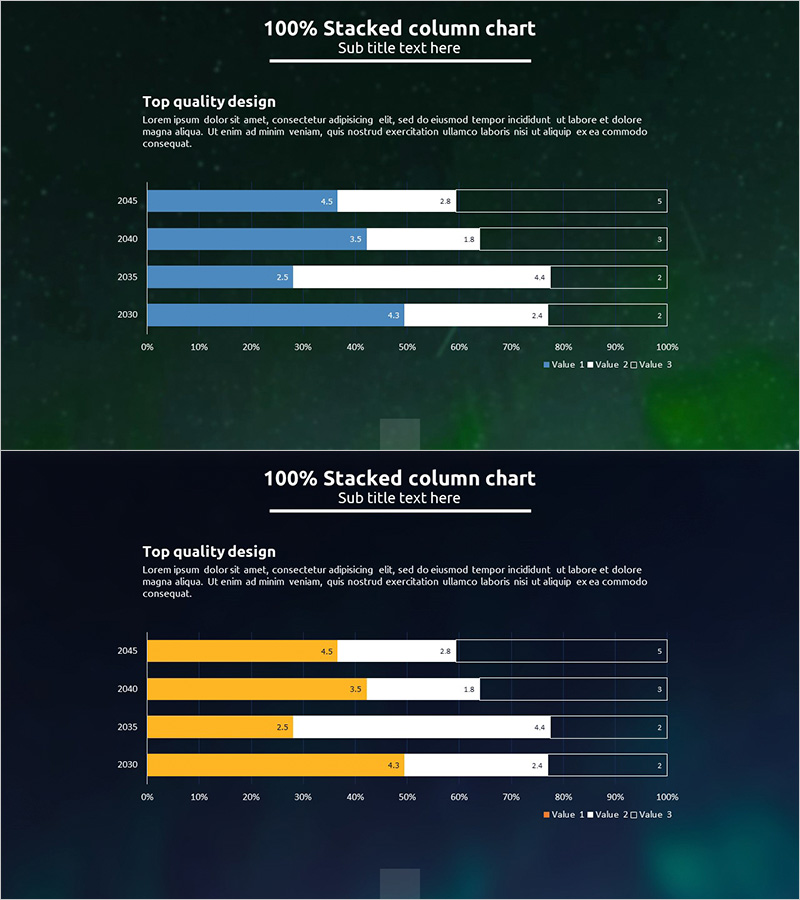
A 100% stacked horizontal bar chart PowerPoint slide designed to visualize camping business market share trends across four years (2030–2045). The chart displays three data series (Value 1, Value 2, Value 3) with distinct color coding—blue, white, and green—against a dark green background for professional contrast. Each bar represents the full 100% market composition, allowing viewers to compare proportional changes year-over-year at a glance. The 16:9 widescreen format includes two fully editable slides ready for business presentations, competitive analysis reports, and strategic planning sessions.
Usage Points
-
Main Usage
This slide enables clear visualization of year-over-year market share proportions and competitive positioning. The 100% stacked format shows how each data series contributes to the total market, making it ideal for strategic business reviews, investor presentations, and market trend analysis.
-
How to Use
Open the slide and replace the sample data (2030–2045 years and Value 1–3 series) with your actual market figures. Customize the legend labels, axis titles, and color scheme to match your company branding or industry context. All chart elements are fully editable within PowerPoint.
-
Recommended For
Marketing managers, business strategists, and executives in camping, leisure, and tourism industries. Ideal for quarterly business reviews, investor pitch decks, competitive analysis reports, and C-suite presentations requiring data-driven insights.
-
Slide Structure
Two slides with title and subtitle areas, each featuring one 100% stacked horizontal bar chart. The chart displays four years (2030, 2040, 2035, 2045) on the Y-axis and 0–100% proportions on the X-axis, with three color-differentiated data series showing cumulative market composition.
Related Products
-

Navy-Orange 100% Stacked Chart
#Market and Competitor Analysis #Graph #Industry Trends
-

Yellow Green Detailed Analysis Chart - Visualizing Market Trends
#Business Strategy #Market and Competitor Analysis #Diagram
-

Work and Home Life Graph – Market Trends and Design Sensibility
#Market and Competitor Analysis #Graph #Industry Trends
-

Bar Chart for Eco-friendly Practices Trends Visualization
#Market and Competitor Analysis #Graph #Industry Trends
