Graph Slide Visualizing Video Ratings Trends
RJ0800025_10
- Last Update 08/06/2025
- File Size 1MB
- # of Slides 2
- File Format PPTX
- Slide Ratio 16:9
- Color
Keywords
About the Product
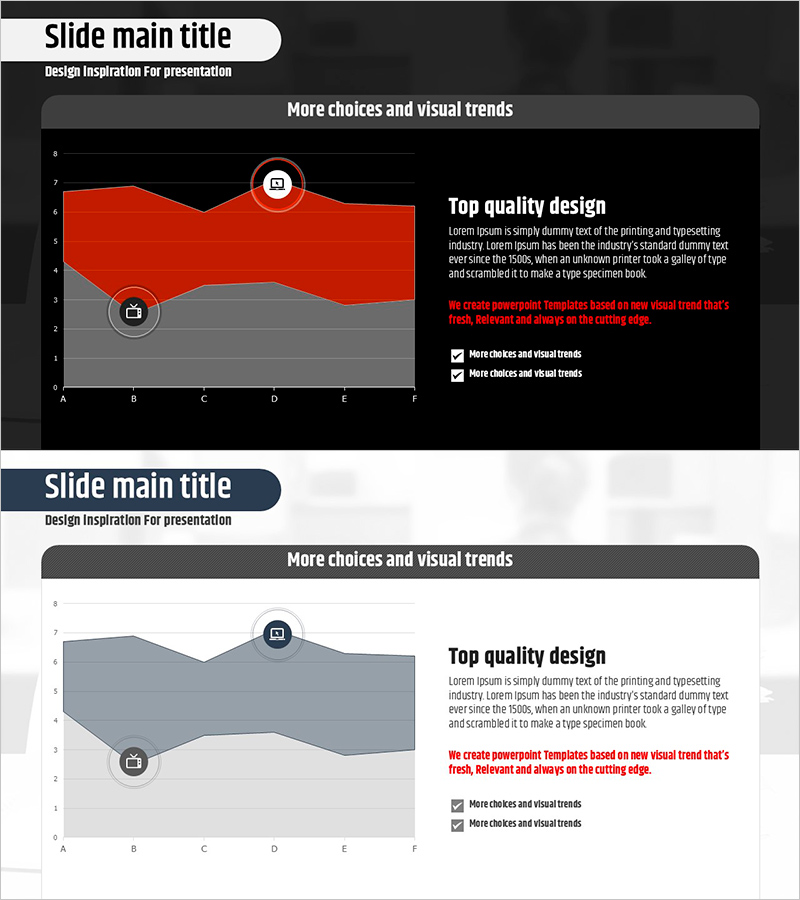
A 2-slide graph presentation set visualizing video viewing rate trends over time. Features a red curve graph on dark and light backgrounds showing time-based viewership data, with text description areas and checkbox items positioned on the right. This PowerPoint slide deck is ready to use immediately in market analysis, competitive benchmarking, and performance reporting presentations. Each slide offers different color tones (dark and light versions) for seamless integration into your overall document design.
Usage Points
-
Main Usage
Visualize video and content viewership data by time period to compare market conditions, competitor performance, and company content metrics at a glance. The curve graph communicates trend changes intuitively and strengthens data credibility in investor, executive, and partner presentations.
-
How to Use
Use in market analysis sections to compare competitor viewing trends, or in performance reports to explain company content performance. Add key insights to the right text area and highlight main points with checkboxes to maximize presentation impact.
-
Recommended For
Ideal for media, broadcasting, and OTT platform executives' reports, content marketing strategy presentations, advertising agency client proposals, and market research reports. Recommended for any presentation requiring data-driven decision-making.
-
Slide Structure
Two-slide layout with left-side curve graph (Y-axis 0-8, X-axis labels A-F), two circular icons in the center, and right-side title, description text block, and two checkbox items. Available in dark and light background versions for flexible document tone matching.
Related Products
-

Avocado Share Chart – Market Status and Competitive Analysis
#Market and Competitor Analysis #Graph #Other
-

3 Market Share Analysis – Differentiated Market Strategy
#Market and Competitor Analysis #Graph #Other
-

Orange Blue Regional Chart Analysis
#Market and Competitor Analysis #Graph #Other
-

Customer Reviews and Feedback on Travel Guides – Market Share Insights
#Market and Competitor Analysis #Graph #Other
