Customer Reviews and Feedback on Travel Guides – Market Share Insights
RJ0600063_5
- Last Update 07/07/2025
- File Size 1.9MB
- # of Slides 2
- File Format PPTX
- Slide Ratio 16:9
- Color
Keywords
- #Content-Based Slides
- #Design-Based Slides
- #Market and Competitor Analysis
- #Graph
- #Other
- #Market Status
- #Market Share
- #16:9
- #market share analysis PowerPoint slide
- #market comparison chart template
- #globe infographic slide
- #how to create market share visualization in PowerPoint
- #travel industry market data slide
About the Product
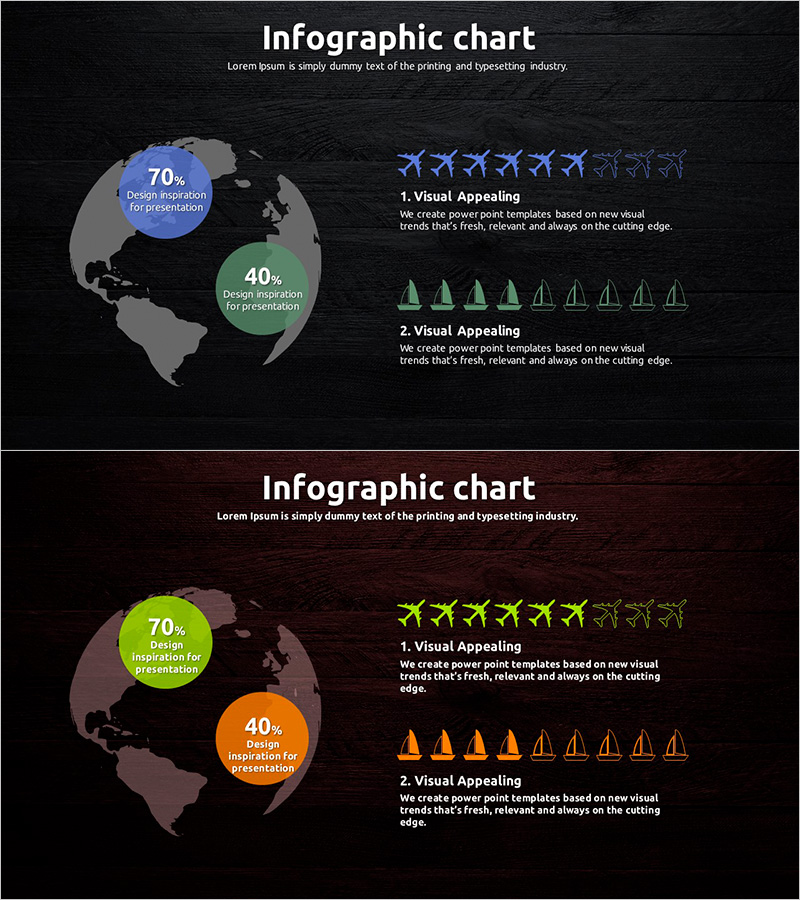
A 2-slide PowerPoint presentation analyzing market share and customer feedback for travel guides and tourism industry. Features a dark background with a globe map and pie charts displaying 70% and 40% proportions side by side. Incorporates airplane and mountain icons as infographic elements with blue, green, and orange accent circles highlighting key metrics. The layout enables clear visual comparison of regional performance and market insights, making it ideal for presentations to stakeholders, investors, and management teams.
Usage Points
-
Main Usage
Visualize market share distribution, regional performance metrics, and customer satisfaction data for travel services, tourism companies, and hospitality businesses. The globe-and-chart combination communicates global market insights effectively to investors, partners, and executives, supporting data-driven decision-making in competitive analysis and strategic planning.
-
How to Use
Slide 1 displays regional market share using pie charts overlaid on the globe map. Slide 2 presents detailed metrics through icon-based infographics with accompanying text descriptions. Simply edit the text boxes and numerical values to input your actual data, then the slides are ready for immediate presentation use.
-
Recommended For
Marketing managers, business development teams, and executives at travel agencies, tourism boards, hotels, airlines, and travel platforms. Suitable for quarterly and annual performance reviews, market research reports, investor pitch decks, and strategic planning meetings.
-
Slide Structure
2-slide layout. Slide 1: Title + globe map + 2 pie charts (70%, 40%) + legend. Slide 2: Title + icon grid (5 airplane icons, 5 mountain icons) + 2 text description areas. Dark background with blue, green, and orange accent colors creating visual hierarchy and information emphasis.
Related Products
-

Avocado Share Chart – Market Status and Competitive Analysis
#Market and Competitor Analysis #Graph #Other
-

Market Share and Usage Status by Application – Statistical Analysis
#Market and Competitor Analysis #Graph #Other
-

Distribution Graph of Food Materials – Market Status Chart
#Market and Competitor Analysis #Graph #Other
-

3 Market Share Analysis – Differentiated Market Strategy
#Market and Competitor Analysis #Graph #Other
