Default Line Graph for Market & Competitor Analysis – Competitive Advantage
RJ0800024_6
- Last Update 08/06/2025
- File Size 1MB
- # of Slides 2
- File Format PPTX
- Slide Ratio 16:9
- Color
Keywords
- #Content-Based Slides
- #Design-Based Slides
- #Market and Competitor Analysis
- #Graph
- #Competitor Analysis
- #Competitive Advantage
- #Line
- #Line Chart
- #16:9
- #line graph PowerPoint slide
- #market analysis presentation template
- #competitor comparison chart
- #trend analysis slide
- #data visualization template
- #line chart download
About the Product
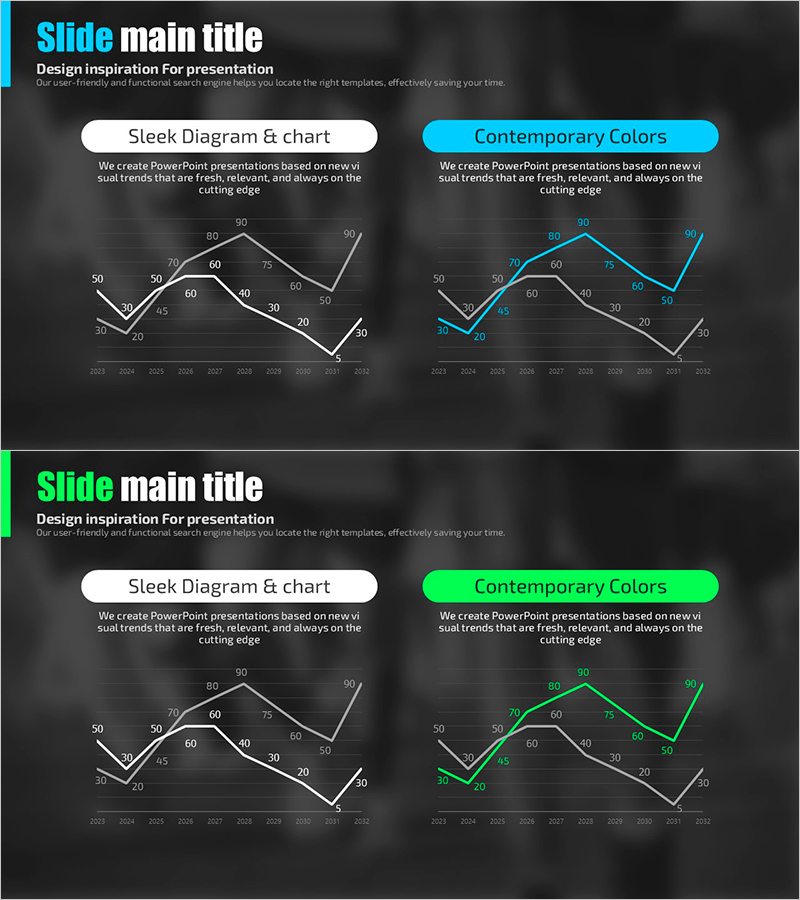
A dual-series line graph PowerPoint slide optimized for market analysis and competitor comparison presentations. The dark background design features two data series visualized with cyan and white lines, clearly showing contrasting trends across time. Spanning from 2023 to 2032 with monthly data points, this slide is ready for immediate use in competitive advantage analysis and market trend discussions. Provided in 16:9 widescreen PPTX format with full data editing and color customization capabilities.
Usage Points
-
Main Usage
Displays time-based trend changes using two data series for market analysis and competitor comparison presentations. Ideal for competitive advantage analysis, performance trend tracking, market dynamics visualization, and quantitative data-driven decision-making materials.
-
How to Use
The dark-background slide features two line series with monthly data points from 2023 to 2032. Input your data values and the graph updates automatically. Use in corporate strategy presentations, quarterly performance reports, and market research discussions as the trend comparison section.
-
Recommended For
Strategy planners, marketing professionals, sales leaders, and executives presenting performance reports benefit from this template. Particularly suited for business presentations requiring quarterly or annual performance comparisons and competitive positioning.
-
Slide Structure
Two-slide set with dark backgrounds featuring dual-series line graphs. First slide emphasizes white line data, second highlights cyan line data. Both include 10-year monthly data points (2023–2032) with numerical labels for each data point.
Related Products
-

Visualizing Market Analysis with Line Chart – Harmony of Mint and Orange
#Market and Competitor Analysis #Diagram #Graph
-

Market Insights Through Competition Analysis Chart – Gaining Competitive Edge
#Market and Competitor Analysis #Graph #Competitor Analysis
-

Fantastic Wide PowerPoint Line Chart – Ideal for Market Analysis
#Market and Competitor Analysis #Graph #Competitor Analysis
-

Line Graph for Comparative Analysis – Highlighting Competitive Advantage
#Market and Competitor Analysis #Graph #Competitor Analysis
