Business Competitor Analysis Graph
RJ0300053_10
- Last Update 05/02/2025
- File Size 1.6MB
- # of Slides 2
- File Format PPTX
- Slide Ratio 16:9
- Color
Keywords
- #Content-Based Slides
- #Design-Based Slides
- #Market and Competitor Analysis
- #Graph
- #Competitor Analysis
- #Competitive Advantage
- #Line
- #Line Chart
- #16:9
- #line chart PowerPoint
- #trend graph template
- #competitor analysis slide
- #dual-series chart
- #data visualization PowerPoint
- #business graph slide template
About the Product
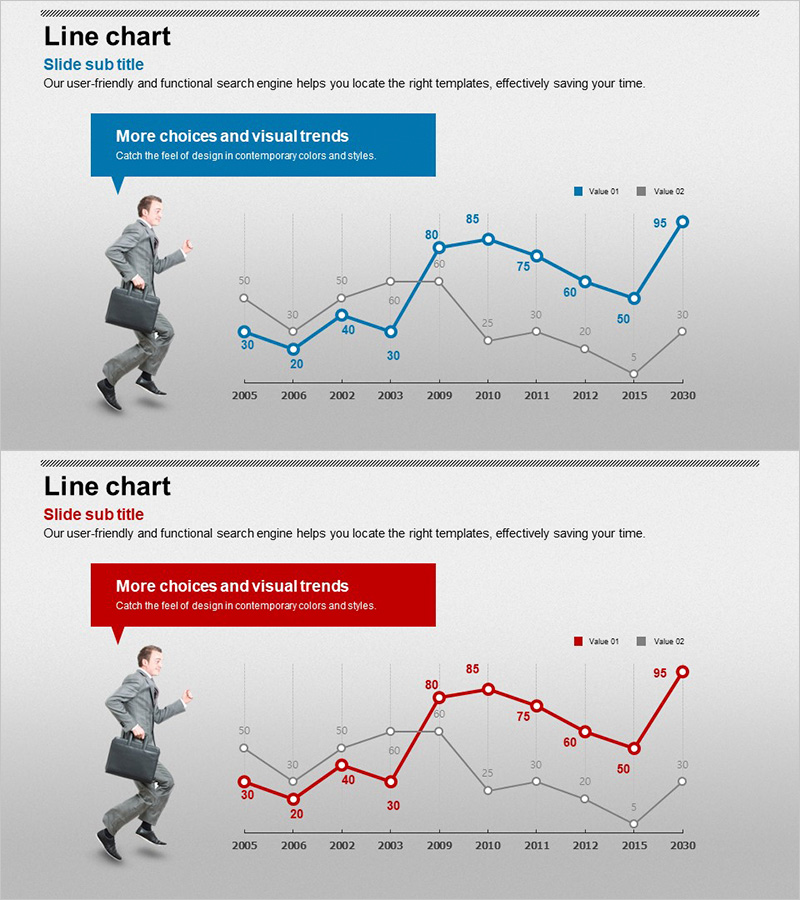
A dual-series line chart PowerPoint slide designed for competitive analysis and market trend visualization. This presentation template displays data from 2005 to 2030 across two distinct series, enabling clear comparison of competitor performance and market dynamics. The blue and gray color scheme provides strong visual contrast between datasets, while numeric labels at each data point ensure precise value communication. Ideal for business presentations, market analysis reports, and strategic planning decks where trend comparison and competitive positioning are critical to your message.
Usage Points
-
Main Usage
Compare competitor performance, analyze market trends, and track year-over-year growth across multiple data series over extended periods. Effectively communicate competitive positioning and market dynamics in executive briefings, investor presentations, and strategic planning meetings using objective numerical data.
-
How to Use
Select the dual line chart on the slide and input your data values. Replace the default legend labels (Value 01 and Value 02) with your specific metrics or competitor names. Update the numeric values for each year, and the chart automatically reflects your data. Customize colors, line thickness, and marker styles to match your corporate branding guidelines.
-
Recommended For
Executives, marketing managers, business development teams, financial analysts, and management consultants presenting competitive analysis, market research findings, and performance comparisons. Particularly suited for strategy meetings, board reports, and client proposals where long-term trend emphasis is essential.
-
Slide Structure
Two-slide layout, each featuring a dual-series line chart. The X-axis displays years from 2005 to 2030, while the Y-axis shows a 0–100 numeric scale. Data points include precise value labels, with dedicated legend and title areas for contextual explanation and professional presentation.
Related Products
-

Social Network Market Competitor Analysis PPT – Data Driven Competitive Advantage
#Market and Competitor Analysis #Diagram #Graph
-

Financial Market Competitor Analysis Template – Emphasizing Competitive Advantage
#Market and Competitor Analysis #Graph #Competitor Analysis
-

Mobile Service Technology Analysis Graph – Market and Competitor Analysis
#Market and Competitor Analysis #Diagram #Graph
-

Broken Line Competitive Advantage Analysis – Market and Competitor Insights
#Market and Competitor Analysis #Graph #Competitor Analysis
