Transport Bar Graph for Visualizing Market Trends – Competitive Advantage Analysis
RJ0800023_20
- Last Update 08/05/2025
- File Size 2.2MB
- # of Slides 2
- File Format PPTX
- Slide Ratio 16:9
- Color
Keywords
About the Product
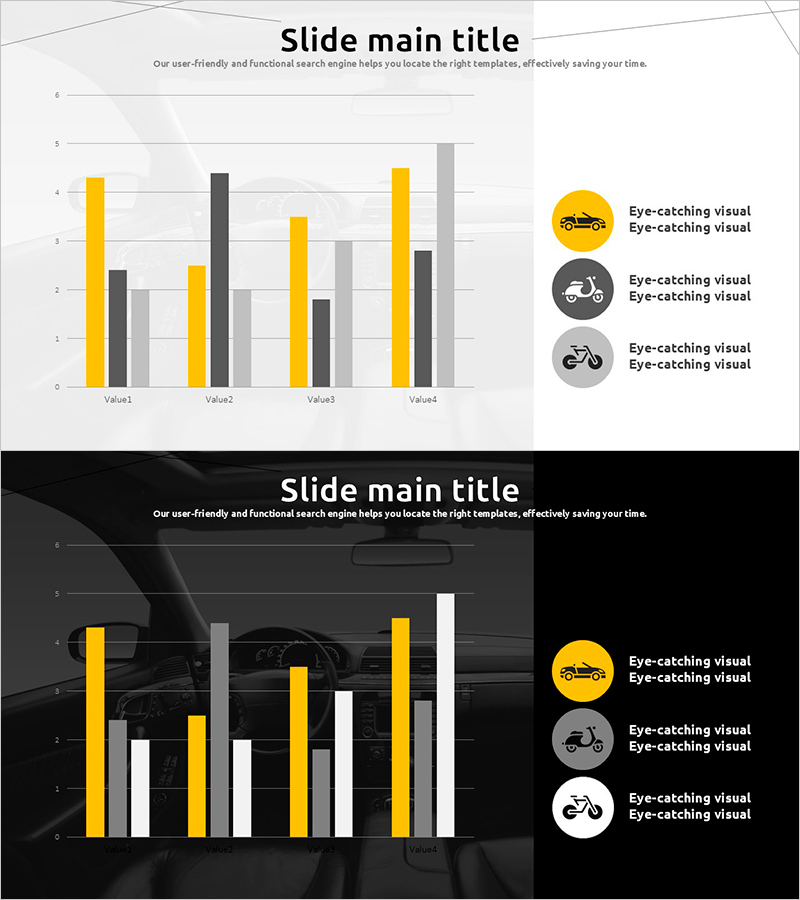
A grouped bar chart PowerPoint slide designed for transportation market analysis and competitive advantage visualization. The slide features a light gray background with yellow and dark gray bar series comparing four data points (Value1 through Value4), making it ideal for market share analysis and competitive positioning presentations. The 2-slide set includes both light and dark background versions, complete with icon legend (car, motorcycle, bicycle) for immediate use in transportation-related presentations. Delivered in 16:9 widescreen PPTX format, fully editable in all PowerPoint versions.
Usage Points
-
Main Usage
Visualizes comparative data across transportation, logistics, and automotive industries by displaying market share, sales volume, or customer preference metrics using two bar series. The horizontal bar format enables clear numerical comparison and helps audiences quickly grasp relative performance differences.
-
How to Use
Select Slide 1 (light gray background) or Slide 2 (black background) based on your presentation environment. Modify bar lengths and colors to input your actual data values, then replace legend icons and text labels to match your specific topic and branding.
-
Recommended For
Ideal for business reports, market analysis presentations, investor relations (IR) pitches, and marketing strategy decks in automotive, logistics, and transportation sectors. Recommended for marketing, sales, and business planning professionals who need to present competitive comparisons, market share trends, or product performance metrics.
-
Slide Structure
Each slide contains a title area, four horizontal bar groups (Value1–Value4) with two series (yellow and dark gray), horizontal gridlines (0–6 scale), and a right-aligned legend with three icons and corresponding text labels. All bar widths, colors, legend text, and data points are fully customizable.
Related Products
-

Bundled Graphs and Maps for Business Plan Visualization
#Market and Competitor Analysis #Graph #Other
-

Plotting Paper Presentation Template Column Chart – Business Strategy Analysis
#Business Strategy #Market and Competitor Analysis #Graph
-

Modern Business Plan Template – Clustered Column Graph
#Market and Competitor Analysis #Graph #Market Analysis
-

Comparative Chart Analysis – Optimized for Market and Competitive Analysis
#Market and Competitor Analysis #Graph #Market Analysis
